- Improvement in gold’s price action in recent sessions
- Key will be if non-commercials begin to add to net long gold futures
- Looks to be bottoming, but still tentative; short GLD puts safe way to go for now
Gold ($1,187.9) is giving out signs that it is in the process of bottoming… the only question is duration. Is it going to be a short-, medium- or long-term bottom?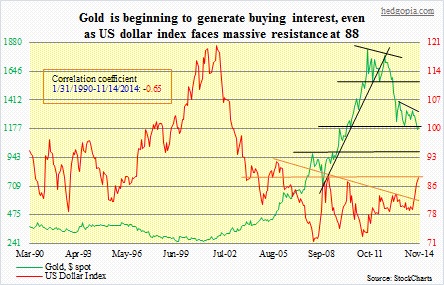
There are lots of reasons not to like gold. Just look at the chart above (monthly closes are used, hence do not properly reflect the daily swings). Plain ugly! Since the September 2011 peak ($1923.7) until the intra-day low six sessions ago ($1130.4), the yellow metal bled 41 percent. This at a time when central banks are printing money hand over fist! Counterintuitive. When gold peaked three years ago, QE2 had just ended, and the Fed was in a pause mode. Late 2012, QE3 got launched, yet that failed to provide a tailwind for gold.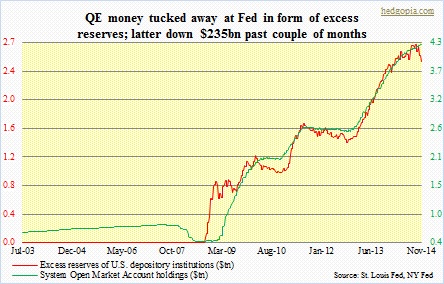
To be fair, gold is still substantially up from its $253 July 1999 bottom. So the decline the past three years is just a noise in a big scheme of things. Come to think of it. Nonetheless, it must be disheartening for a gold bug to see the price weaken when central banks are flooding the system with liquidity. Inflation has been a no-show, and in all likelihood is not going to be the reason gold will rally any time soon. All that money the Fed has created is sitting in excess reserves. Money velocity continues to go down. We should probably begin to worry about inflation if and when these reserves begin to flow into the system. Right now, disinflation rules, with risks of deflation. (The past couple of months, reserves have gone down by $235bn.)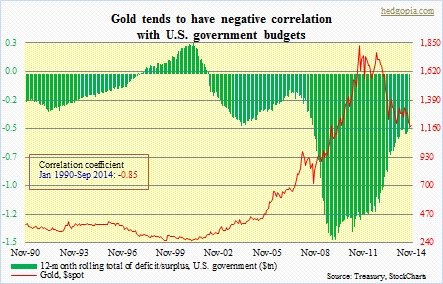
Seniors are the fastest growing population in the world. Not to mention there is simply too much leverage in the system, with an increasing amount of debt required to produce the same amount of output. It turns out, as the chart above shows, gold tends to correlate with government budgets — negatively, of course. On that front, the U.S. is making progress – if we can call that. Last fiscal year, the country still racked up nearly $500bn in deficit, but that is substantially less than what has been in recent years.
Then there is the supply-demand dynamics. In the first three quarters of the year, as per the World Gold Council, gold production was 724 tonnes, 757t, and 812t, respectively. Annualized, it will match next year’s 3,054t. Prior to that, 2012 was 2,870t, and 2011 2,842t. (Recycled gold is on track to providing about 26 percent of total supply this year.) In the meantime, gold demand has progressively come down from 4,702t in 2011 to 4,589t in 2012 to 4,080t in 2013; 2014 is on track for 3,900t (three quarters annualized).
Insofar as gold bears are concerned, these are probably good reasons not to fancy gold. Plus, gold does not produce any cash flow, and pays neither interest nor dividend. All these factors may very well have combined to lead investors to head for the exits. But the rubber band can only be stretched so much. In the markets, there comes a point when sellers will exhaust themselves. The futures market is a good place to gauge investor sentiment.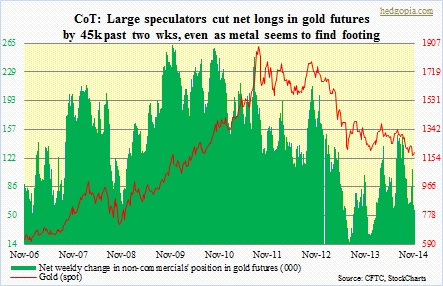
Large speculators’ net longs in gold futures peaked at 150k contracts in the first week of July this year, which is when gold peaked at $1,347/ounce before beginning another leg lower. Most recently, their net longs peaked on October 21st at 108k; once again, gold peaked at $1,256/ounce. In the next three weeks, non-commercials proceeded to reduce net longs further, to 56k last week. It can be argued that gold will only bottom once these speculators completely capitulate. The last time they were net short was 2002. But here is a counterargument.
On November 7th, spot gold saw a high-volume engulfing candle. That did not tempt these hedge funds into going it slow. The following week (last week), they added another 8k to their shorts. Non-commercials for the most part tend to follow the trend. Action on gold has improved. Last Friday, gold had another high-volume engulfing candle. This could very well convince these traders to cover and flip into longs. We will see. But odds are growing.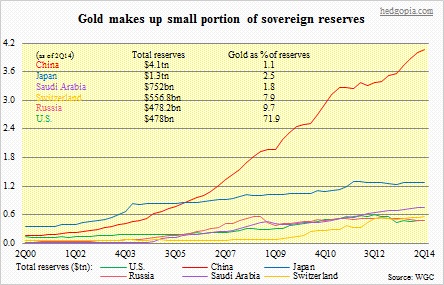
Needless to say, leading up to all this, sentiment had been extremely bearish. Gold even broke the all-important $1,180 support and stayed underneath that for 10 consecutive sessions. It is now back above it – barely. But in the process, it has hammered out two weekly hammers. In the past seven sessions, there have been four doji’s. These are signs of a real tussle going on between bulls and bears. Buyers are beginning to show up. It is possible the upcoming November 30th Switzerland referendum is playing a role here. [Voters will decide on (1) prohibiting the Swiss National Bank from further gold sales, (2) repatriating Swiss-owned gold to Switzerland, and (3) mandating gold make up at least 20 percent of the SNB’s assets, though it does not specify if it has to be held in physical or derivative form.] As the chart above shows, it is at about eight percent now. Notice that with all its reserve-currency ambitions, China holds a mere one percent of its massive $4.1tn reserves in gold.
Price action on gold the past couple of weeks is encouraging. This thing is itching to go higher. The only question is of duration. Conservatively, it might make sense to sell some puts – like GLD ($114.47) Dec 14 115 for $3.25 each.

