
After healthy growth last three quarters, the U.S. economy is in deceleration, magnitude and duration notwithstanding.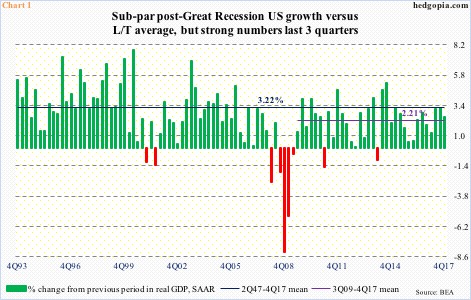
On Wednesday, the Atlanta Fed’s GDPNow model was forecasting 1Q18 real GDP growth of 1.9 percent, revised down from 2.5 percent, reflecting this week’s release of retail sales and consumer price index for February.
With two weeks to go before the quarter is over, the downward revision would have followed healthy growth in the last three. Real GDP grew 2.5 percent in 4Q. This was preceded by growth of 3.2 percent in 3Q17 and 3.1 percent in 2Q17. All these three quarters grew above the post-Great Recession average of 2.2 percent. After this kind of growth, deceleration is only natural.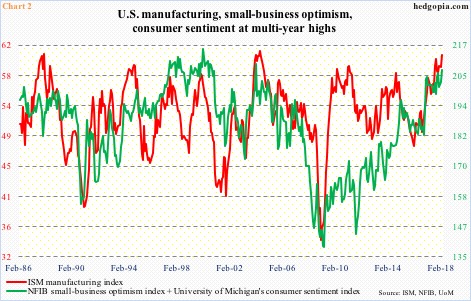
This is particularly so considering several other data points – soft in particular – are already at multi-year highs.
The ISM manufacturing index in February rose 1.7 points month-over-month to 60.8. This was the highest since May 2004. The increase in manufacturing activity has gone hand in hand with a rise in both consumer sentiment and small-business optimism. In Chart 2, the green line adds up the latter two.
The NFIB optimism index in February inched up 0.7 points m/m to 107.6, the second highest level in its 45-year history. The University of Michigan’s consumer sentiment index, too, jumped four points m/m last month to 99.7, just a point shy of last October’s cycle high, which was the highest since January 2004.
The February readings come in the wake of last December’s tax cuts. Optimism remains very high. Hence growing odds of either a pause or a reversal.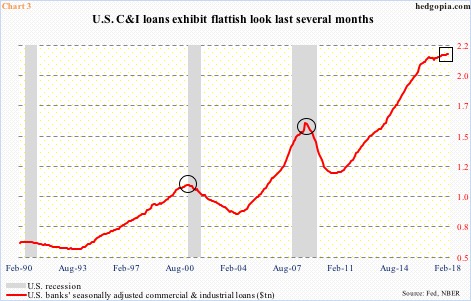
As manufacturing takes a break from its torrid pace, repercussions will probably be felt in U.S. banks’ commercial & industrial loans. These loans already have a rather flattish look to them.
In February, C&I loans rose $1.8 billion m/m to seasonally adjusted $2.13 trillion. Since last September, they have only grown by $7.4 billion (box in Chart 3). The circles also show how the red line behaved during, or just prior to, last two recessions. These loans have had quite a rise, up from $1.18 trillion in October 2010. They are worth watching. As is the green line in Chart 4.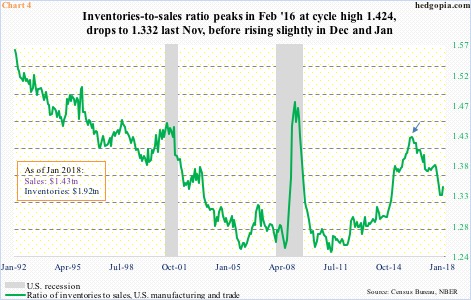
The ratio of inventories to sales in manufacturing and trade peaked in February 2016 at 1.424 (arrow). This was a cycle high (arrow in Chart 4). Incidentally, U.S. stocks reached a major bottom in that month.
After persistently falling since that high, the ratio bottomed last November at 1.332. January was 1.344. In a scenario in which GDP growth decelerates and manufacturing softens, there is plenty of room for the ratio to continue higher. Since that November low in the green line, inventories have grown 1.2 percent to $1.92 trillion and sales only 0.2 percent to $1.43 trillion.
Thanks for reading!
