
- Sideways movement in margin debt a sign investors’ risk appetite waning?
- 35-year correlation between stocks and margin debt of 0.95, 2014 was only 0.28
- In 2000 and 2007, peak in margin debt preceded peak in C&I loans by one-plus year
Just what is the deal with margin debt? Since the high watermark in February last year ($466bn), it has only managed to go sideways. The December reading was $456bn. In the meantime, from February-end to December-end last year, the S&P 500 large cap index tacked on another 11 percent (Chart 1). Makes one wonder, if stocks have not cracked, why are investors hesitating to add more leverage? Particularly considering that these two have maintained an R of 0.95 going back to January 1980. In 2014, the correlation dropped to 0.28. Why the divergence?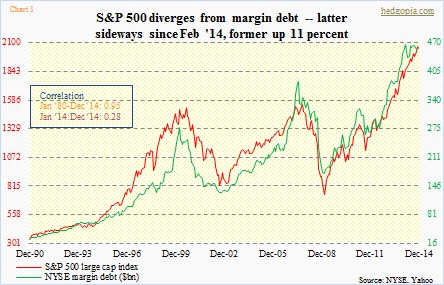
Unquestionably, as margin debt has soared to new heights, net credit balance has gone on to plummet to new lows (Chart 2). The balance (free credit cash accounts plus credit balances in margin accounts minus margin debt) is essentially net worth. So is this a simple case of declining buying power?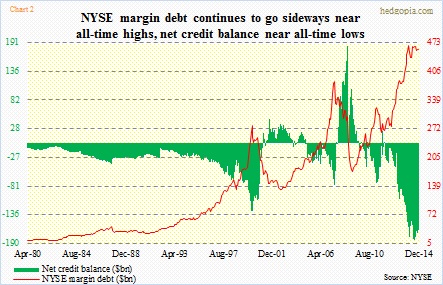
Another explanation is that there is risk-off attitude in some corners of credit. U.S. high-yield debt peaked in June last year. Investors are also not gung ho about small-cap stocks – another indicator of preference, or a lack thereof, for risk-on. The Russell 2000 small cap index has been trapped in a range for nearly a year now. Having said that, stocks in general nonetheless are near all-time highs, essentially pooh-poohing signals coming out of bonds and commodities.
So the obvious question is, has margin debt peaked?
Back in July 2007, it peaked at $381bn, followed by a peak in the S&P 500 in October; by September that year, margin debt was down nearly 14 percent. In 2000, both peaked in March (margin debt at $278bn). By August/September that year, the S&P 500 nearly revisited the March highs, with margin debt only rising to the $250bn range. This time around, after the February peak last year, it did drop six percent by April, before quickly reasserting itself. So a comparison of how margin debt behaved in 2000 and 2007 and how it is behaving now offers no help.
With that, if it has peaked, there will be repercussions.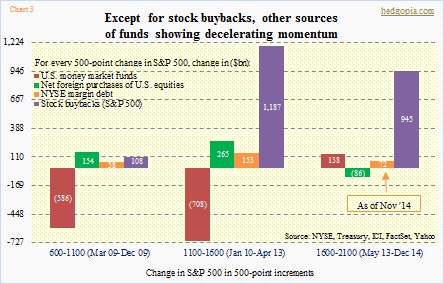
Chart 3 focuses on four primary sources of funds for U.S. stocks, dividing the advance in the S&P 500 since March 2009 in three 500-point increments – from 600 to 1100, 1100 to 1600 and then 1600 to 2100. Between March and December 2009, foreigners purchased $154bn in U.S. equities, NYSE margin debt went up by $58bn, and stock buybacks brought in $108bn. Plus, money-market funds shrank by $586bn. All stock positives. (Quarterly numbers are used for buybacks, so they are approximation.)
In the second 500-point increment, all four picked up the pace. Not so in the third. As a matter of fact, money-market funds and foreign purchases were negative contributors. Margin debt was still contributing but the pace had decelerated. It was the buybacks that was keeping the boat afloat, and even there, there was deceleration. With that as a background, sideways margin debt cannot be good news. Incidentally, year-to-date, money-market funds have declined $47bn – a plus.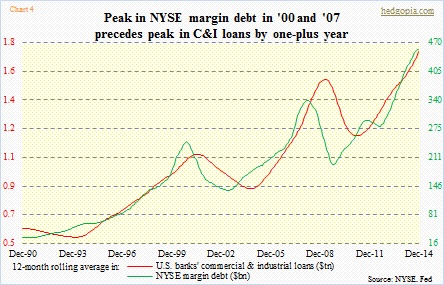
And then this. This is an interesting one. In both 2000 and 2007, peak in margin debt preceded a peak in U.S. commercial & industrial loans (Chart 4). After the March peak in 2000, C&I loans topped out in February 2001 at $1.1tn. Then post-peak in July 2007, C&I loans peaked at $1.6tn in October 2008. If margin debt did indeed peak a year ago, then based on this relationship we could be looking at a peak in C&I loans soon. They were $1.8tn in December.
