
U.S. corporate profits adjusted for inventory valuation and capital consumption grew 1.3 percent quarter-over-quarter in 2Q17 to a seasonally adjusted annual rate of $2.14 trillion, but growth has been uneven since peaking at $2.23 trillion in 4Q14.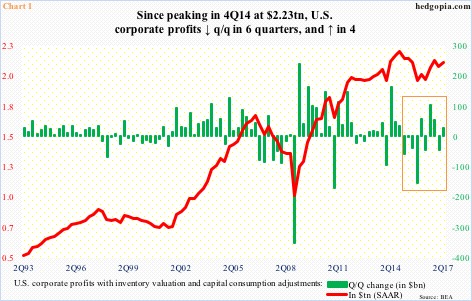
Since that peak 10 quarters ago, profits grew in six quarters and fell in four (box in Chart 1). Cumulatively, they are down $96.2 billion in total.
Year-over-year, profits increased seven percent in 2Q17. This was the third consecutive quarter of growth, following five straight quarters of shrinkage.
For whatever it is worth, the previous cycle peaked at $1.69 trillion in 3Q06. The S&P 500 large cap index peaked in 4Q07, in October. It was not until 3Q10 the 3Q06 high was surpassed.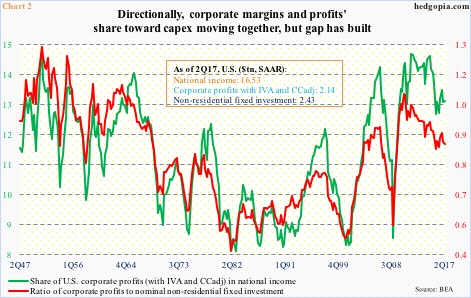
One stark difference between now and the prior cycle is that this time around profits have refused to fall apart after peaking.
Margins are the same away. The green line in Chart 2 is a proxy for corporate margins. After peaking at 14.5 percent in 4Q11, surpassing the 3Q06 high of 14 percent, margins fell all the way to 12.5 percent in 4Q15 before stabilizing, with 2Q17 at 12.9 percent.
Historically, margins track a ratio between profits and non-residential fixed investment. The latter is a proxy for corporate capital expenditures, which in 2Q17 was at a seasonally adjusted annual rate of $2.43 trillion.
In 2Q17, non-residential fixed investment comprised 12.2 percent of nominal GDP ($19.25 trillion), having peaked at 13.1 percent in 3Q14 (not shown here). Capex is subdued, and this shows up in the red line in Chart 2. Directionally, the two lines move together, but the gap between the two has increased.
This cannot be helping the profit outlook in years to come as this affects productivity.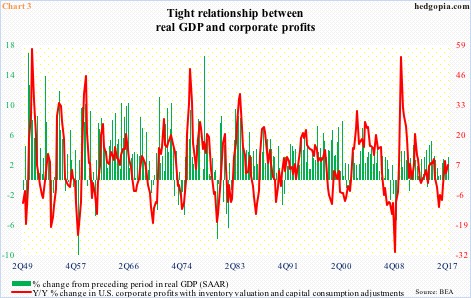
Productivity is already suppressed.
Preliminarily, non-farm output per hour rose 1.2 percent y/y in 2Q17 – the highest growth rate in eight quarters, three of which were negative. This impacts GDP growth, which, in turn, is tightly correlated with corporate profits.
On Wednesday, annualized real GDP growth in 2Q17 was revised higher to three percent. This was the best growth rate in nine quarters. Post-Great Recession growth otherwise has been subdued, with an average of 2.2 percent, versus 3.2 percent going all the way back to 2Q47.
The U.S. economy is in its ninth year of recovery. With productivity the way it is and the unemployment rate at 4.3 percent, it is hard to imagine output accelerating from here.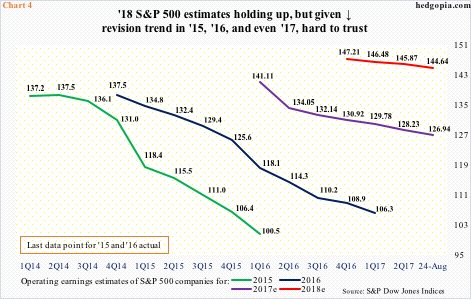
It is because of all these variables it is hard to trust next year’s consensus earnings estimates for S&P 500 companies.
As of a week ago, the sell-side has penciled in $144.64 in operating earnings in 2018. In January this year, this was $147.21, so downward revision has been muted. Muted particularly considering how 2015 and 2016 fared, with actual earnings substantially below what was expected (Chart 4).
Even 2017 has not remained immune from this, although the curve thus far is not as downwardly sloping as was the case in ’15 and ’16. Should ’17 earnings ($126.94 currently) come through, this would represent growth of 20 percent over ‘16. On top of this, ’18 is expected to grow another 14 percent.
Doable?
Not until growth accelerates, which if materializes potentially changes the Fed’s tightening outlook, pulling growth down in the end. Tax cuts, if they become a reality, may help, but, as things stand, it is safer to bet ’18 estimates will meet the same fate as ’15-’17.
Thanks for reading!
