
What exactly would Fed officials be focused on when they decide to hike – or not – rates? It is a fair question given the amount of variance in their message.
On Tuesday evening, John Williams, president of the San Francisco Fed, repeated his October 1st stance when he said the decision not to raise rates at the Federal Open Market Committee (FOMC) meeting last month was “a close call.” In fact, he delivered the same speech.
Mr. Williams, a voting member of the FOMC, also said he was “starting to see signs of imbalances emerge in the form of high asset prices, especially in real estate, and that trips the alert system.”
“But all in all, things are looking up, and if they stay on track, I see this as the year we start the process of monetary policy normalization.”
To be fair, he has been arguing for a rate hike for a while now. If one were to just focus on domestic data, that argument looked spot-on early this year, but hardly so now. So what is driving the hawkish voice within the FOMC? Is it simply an attempt to fill the monetary quiver with arrows? Makes you wonder.
In between Mr. Williams’ two speeches we have had lousy jobs number (September), weak ISM reports (September), in particular manufacturing, and weak durable goods report (August).
Here is the irony. Increasingly, the behavioral gap between the haves (business) and have-nots (consumers) is widening – the former cautious in spending/investing and the latter almost careless.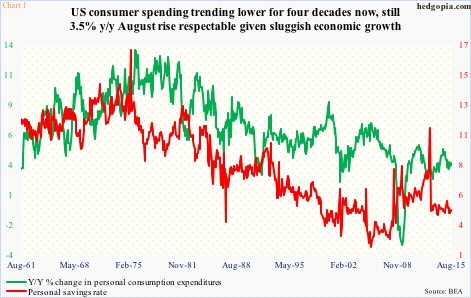
Despite tentative GDP growth, consumer spending is hanging in there – relatively. Personal consumption expenditures were $12.4 trillion (seasonally adjusted annual rate) in August – up 3.5 percent year-over-year. The growth rate has been decelerating over the past 40 years (Chart 1), but on an absolute level, PCE has doubled the past 16 years. The personal savings rate stood at a mere 4.6 percent in August.
Consumers are not financing all this with rising wages and incomes. Yes, they are rising, but there is not much wage growth to speak of.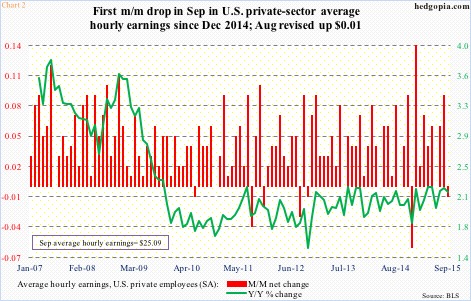
In September, average hourly earnings dropped a penny month-over-month, to $25.09, and rose 2.2 percent year-over-year. The last time AHE grew with a three handle was in April 2009 (Chart 2). The inability of wage growth to get traction is coming in the midst of a 5.1 percent unemployment rate – hardly a true reflection of the jobs market. More and more Americans are exiting the labor force… the number stood at 94.6 million in September, versus 80.9 million in June 2009.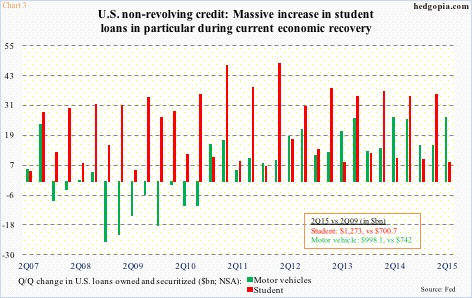
Not surprisingly, leverage is on the rise. In August, consumer credit (seasonally adjusted) stood at $3.47 trillion, versus $2.6 trillion in June 2009. Breaking it down, revolving credit (credit card loans, etc.) dropped from $964.5 billion to $918.5 billion in August, but non-revolving jumped from $1.63 trillion to $2.55 trillion. As a result, non-revolving categories such as student and auto loans have gone through the roof, evident in Chart 3. In 2Q09, motor-vehicle loans were $700.7 billion and student loans $742 billions (both not seasonally adjusted). By 2Q15, they had risen/soared to $998.1 billion and $1.27 trillion, respectively. Auto sales, by the way, are on course to reaching 17 million vehicles this year.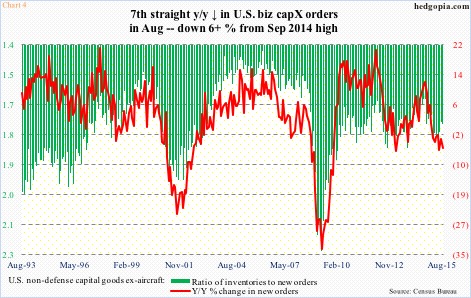
Then we have the haves, which continue to pull in horns when it comes to investments. Corporate profits are near all-time highs – although decelerating – but capital expenditures remain subdued. Chart 4 uses orders for non-defense capital goods ex-aircraft as a proxy for capex. The picture is not pretty. Orders peaked at $74 billion last September, dropping to a tad above $67 billion in February before rebounding to just north of $69 trillion in August. Momentum is lacking, with year-over-year growth negative the past seven months. The ratio of inventories-to-orders has dropped from 1.8 in May to 1.74 in August, but remains elevated.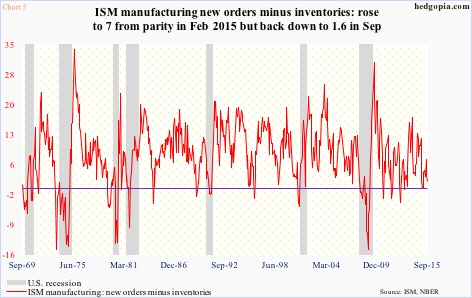
The trend is the same in orders and inventories in the ISM manufacturing survey (although it is a lot better in the non-manufacturing side). In September, the new orders index (manufacturing) dropped from 51.7 month-over-month to 50.1 – barely above expansion. Inventories were unchanged at 48.5. The red line in Chart 5 was at parity in February, before rising to seven in May, and is under pressure again. It is at stall speed at best.
Against this backdrop, it is hard to put two and two together and understand the rationale behind the hawkish tone. It is not the data. It cannot be. If it is anything, it has to be the willingness to fill one’s toolbox – just in case.
The question is, how many of Mr. Williams’ colleagues share his viewpoint?
Thanks for reading!
