
The federal government is up to the gills in debt. Interest payments run up in the billions every year. This was not much of an issue in a low-interest-rate environment. But right now, the Federal Reserve is tightening. Higher rates will bite. This arguably could lead the central bank to hurriedly lower rates ahead. Or maybe not. Given the elevated inflation and the fear that it might get sticky, the immediate worry is to get inflation under control. The Fed is in a no-win situation.
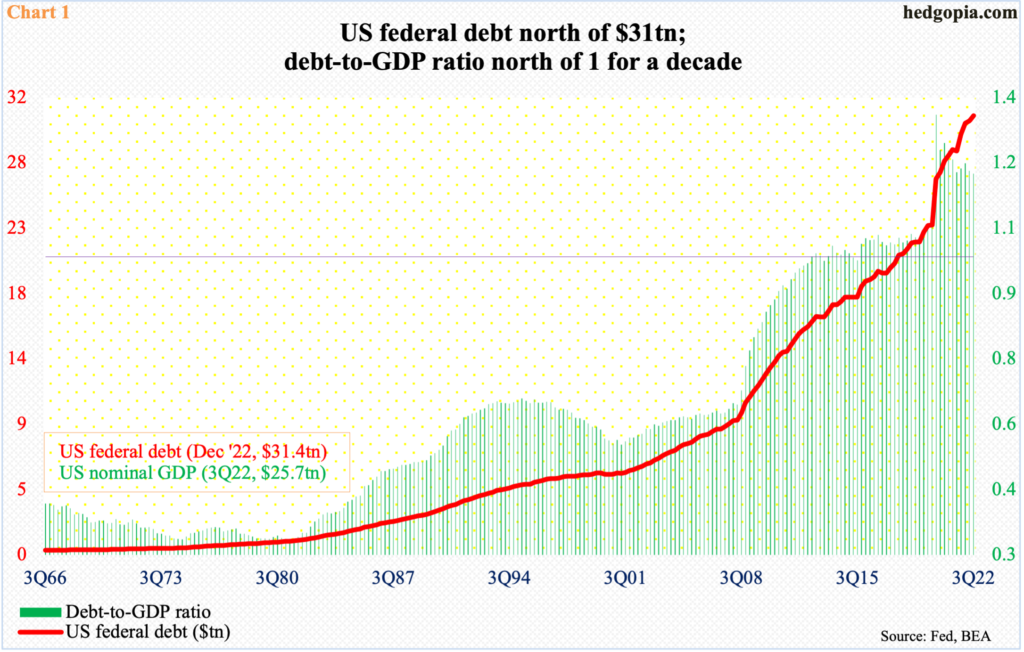
The US national debt currently stands at $31.4 trillion, up from $30.9 trillion at the end of the September quarter, which is what is depicted in Chart 1. The debt load just about doubled in a decade. Going back nearly six decades, federal debt has consistently grown from the lower left to the upper right.
Most recently, debt accumulation went vertical as Covid-19 began to adversely impact the economy and the government launched stimulus programs.
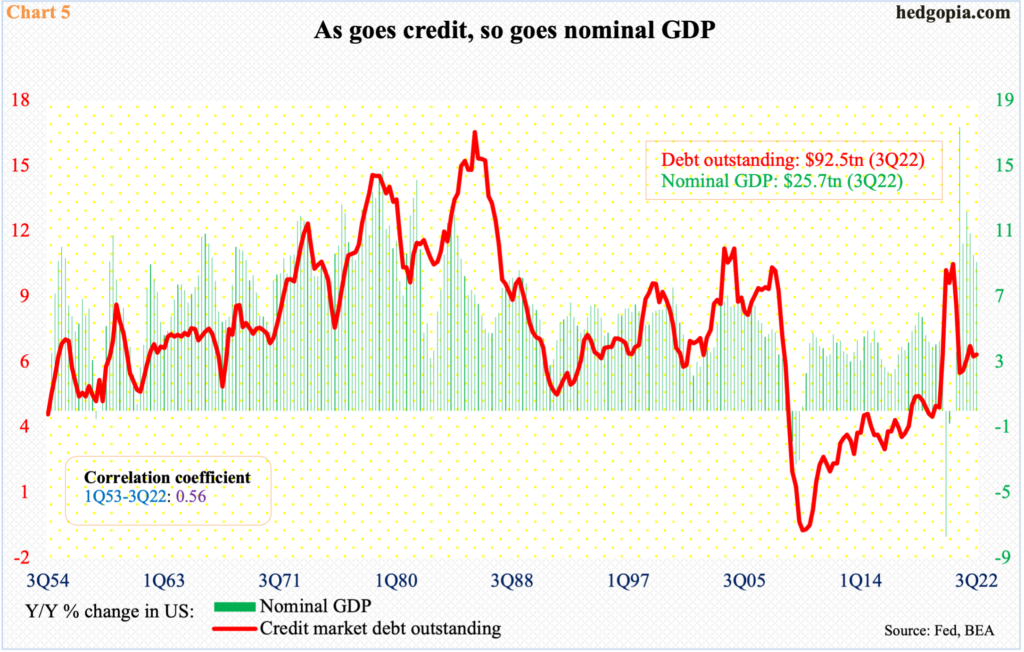
As a result, the debt-to-GDP ratio has persisted over one for a decade now. Nominal GDP was $25.7 trillion in 3Q22.
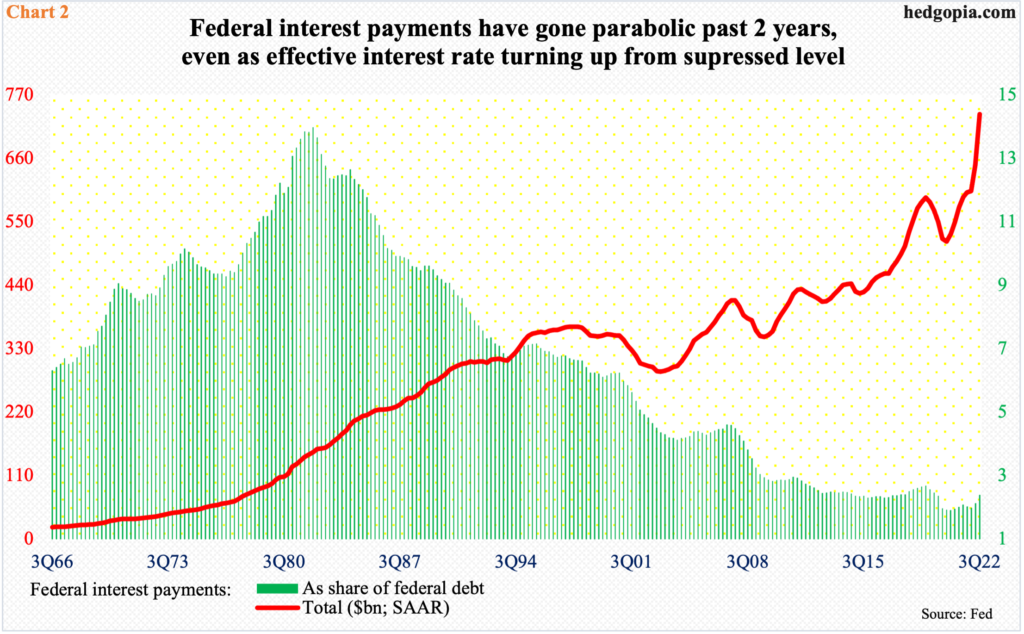
Not surprisingly, the federal government pays a ton in interest. At a seasonally adjusted annual rate of $736.7 billion, a new record was made in 3Q22. Payments in normal circumstances could have been a lot higher but suppressed interest rates in the wake of the 2008 financial crisis helped them remain low – relatively.
This is no longer the case. The Federal Reserve is in a tightening mode. Rates have gone up significantly this year.
As a share of the debt, federal interest payments in 1Q22 came in at 1.98 percent. This can be viewed as an effective interest rate. By 3Q, this had risen to 2.38 percent (Chart 2). The green histograms on the right of the chart have just begun to move up.
At the time of the financial crisis, rates were north of four percent. At four percent, let us say, interest payments last quarter would amount to $1.2 trillion – $500 billion more than the government actually paid. This has the potential to turn the federal budget upside down.
So, the question arises as to if the Fed can keep rates elevated for too long. The short answer is that the central bank is in a no-win situation.
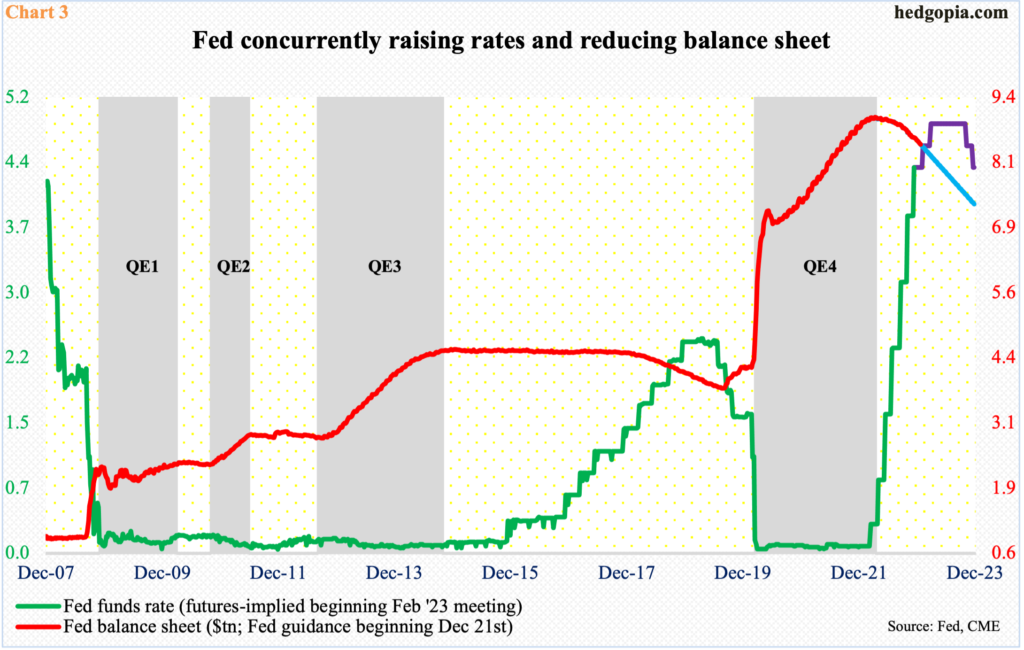
Currently, it is both raising rates and reducing its balance sheet (Chart 3).
The Fed began to raise the fed funds rate in March this year. At the time, the benchmark rates were stuck in a range of zero to 25 basis points. After seven hikes, rates are currently 425 basis points to 450 basis points. At the end of this year’s last FOMC meeting last Wednesday, the dot plot projected rates would peak next year at 5.1 percent and then go sideways. In the post-meeting press conference, Chair Jerome Powell was very clear there will be no rate cuts next year.
Markets disagree. Futures traders continue to forecast rates to peak south of five percent by March next year and for the Fed to begin to cut by November.
These traders are focused on federal interest payments, among others. The Fed is focused on inflation. It operates under a dual mandate of maximum employment and price stability. After Covid-19 ravaged the US economy, it solely aimed at the jobs mandate, flooding the system with liquidity using both conventional (fed funds) and unconventional (balance sheet) methods. Along with trillions in fiscal stimulus, it worked. The side effect of all this is what the Fed is now trying to put back in the bottle – inflation.
This Friday, November’s PCE (price consumption expenditures) index is on tap. In the 12 months to October, headline and core PCE increased six percent and five percent respectively. They peaked in June and February this year at seven percent and 5.4 percent, in that order. The trend is clearly down. If the downward momentum continues, it would not be long before core PCE, which is the Fed’s favorite, gets to two percent.
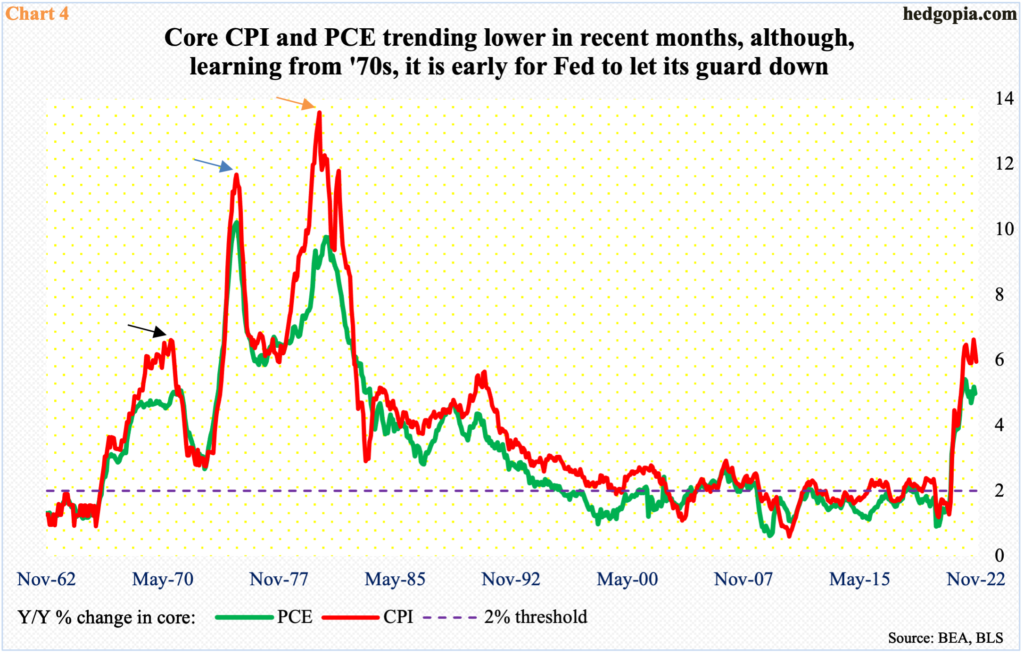
Then, we have Chart 4.
The 1970s teaches us how if inflation is not nipped in the bud in time it keeps coming back. This happened twice in that decade. Core PCE peaked at 5.07 percent in July 1971 and core CPI at 6.6 percent in November 1970 (black arrow), before coming under pressure to bottom at 2.7 percent and 2.8 percent respectively in January 1973.
Then began the next up cycle – surging past ’70-’71 highs. By February 1975, core PCE and core CPI hit 10.2 percent and 11.7 percent respectively (blue arrow). The drop since bottomed in ’76-’77, with both core PCE and core CPI bottoming at 5.9 percent in July ’76 and November ’77, in that order.
After that trough, in a pattern of ‘higher highs, higher lows’, inflation again went vertical. This time around, core CPI and core PCE peaked in 1980 – the former at 13.6 percent in June and the latter at 9.8 percent in November (orange arrow). As it turned out, this was the final surge.
The lesson in all this is that once this beast gets going, it is hard to put a stop to it. So, it is wise to err on overtightening now than loosen too early and pay a steep price later. At least that is how FOMC hawks, including Powell, are probably thinking. And they are not wrong.
Powell has suggested several times that, if the need be, they are ready to drive the economy into a recession. Considering that post-financial crisis a reset never happened, as both Ben Bernanke and Janet Yellen added liquidity fuel to the fire; the so-called Fed put continued on, and markets demanded more and more monetary morphine. The longer this goes on, the deeper the wound.
The only question is if Powell has the fortitude to pull it off. Ironically, as goes credit, so goes GDP (Chart 5). The over-reliance on debt has to go. This would obviously mean pain initially, but once it is over, the growth that follows will have a secure foundation to stand on.
Thanks for reading!
