
One look at Chart 1, and it is not hard to imagine the possible repercussions of the collapse in crude oil. The spot West Texas Intermediate crude traded at $107.68 in June last year, dropped to $42.41 in March, rose to $62.58 in May, before coming under renewed pressure. The impact of the price drop has been felt across employment, capital expenditures and earnings, among others.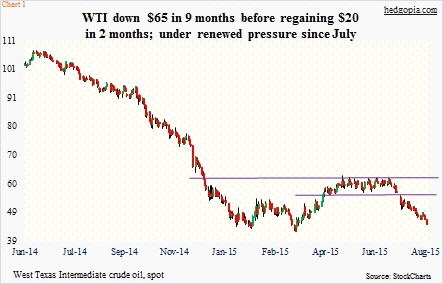
Challenger, Gray & Christmas shows 60,500 job-cut announcements in the energy sector in the first half this year. Real private-sector non-residential fixed investment contracted 0.6 percent in the second quarter – first decline since 3Q12; as early as 3Q14, it was growing at nine percent.
Last but not the least, the collapse in energy earnings is a major reason behind persistent downward revision in operating earnings for S&P 500 companies this year. As of July 30, sell-side estimates dropped to $114.73. At the end of 2Q14, they were $137.50 (Chart 2). If these estimates come in as expected, 2015 earnings would have barely grown over last year’s $113.02 – up only 1.5 percent.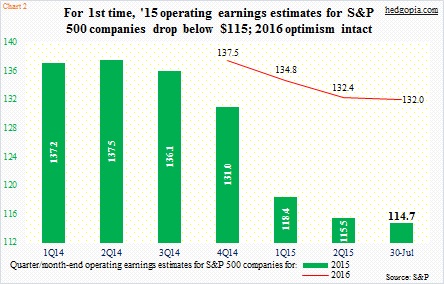
We may just be beginning to see oil’s impact elsewhere.
Foreigners are an important source of demand for Treasuries, as shown by the Treasury’s TIC data. As of May, they held $6.14 trillion in Treasury securities. (June numbers will be reported on the 17th.) As can be seen in Chart 3, May was slightly down from $6.22 trillion in January. But the important thing is the trend. Fifteen years ago, they held less than $1.1 trillion. Over the years, foreigners’ share has kept up with the rise in U.S. debt.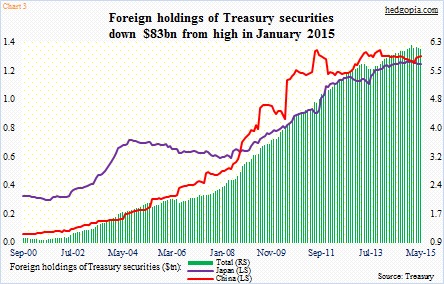
Publicly held Treasury securities outstanding has gone up from below $3 trillion in 2000 to $12.7 trillion in June. China and Japan together now hold more than two-fifths of the total held by foreigners. China’s high was recorded in November 2013 at $1.32 trillion, declining to $1.27 trillion in May, but it remains the largest holder. Japan was second at $1.22 trillion in May, down from $1.24 trillion.
The real shift in ownership is taking place elsewhere – or beginning to. Chart 4 plots holdings of oil exporters along five categories. ‘Oil exporters’ are essentially OPEC, and held $297 billion in May, essentially on par with March’s all-time high. At $86 billion, Mexico, too, is pretty close to its all-time high of $87 billion in April.
The other three are substantially off their highs. Russia’s holdings have steadily been coming down since they peaked at $176 billion in October 2010. Most recently, it held $118 billion as early as last September – now down to $71 billion. Similarly, Norway’s peaked at $90 billion in February 2014 – now $65 billion. Canada’s peaked at $94 billion in February 2011 – now $71 billion.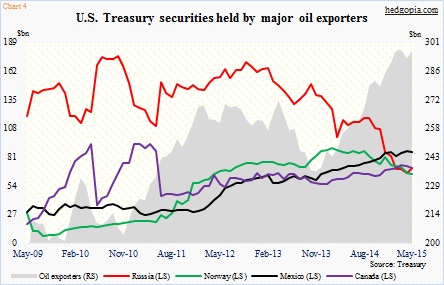
The combined total of all five peaked at the most recent high of $621 billion in April 2014, and has declined to $590 billion in May. The April high coincides with the peak in crude oil last year. It is too soon to say if the decline in holdings is all due to oil. Back in February 2013, their combined total peaked at $629 billion, fell to $565 billion in March last year before regaining momentum. Things could unfold the same way. Or not. A lot will depend on what happens to the price of crude going forward… which will then influence demand for – or a lack thereof – for Treasuries.
Yesterday, spot WTI closed down 3.1 percent, and is now less than $3 away from the mid-March low of $42.41 (Chart 1). That low is a must-hold.
Thanks for reading!
