 At hedgopia, we try to be as objective as possible. Currently, this blogger is bearish insofar as U.S. equities and economy are concerned. Nevertheless, as someone famously said, “When the facts change, I change my mind. What would you do, sir?” (Was it John Maynard Keynes or someone else who said that?) From this perspective, it pays to have an open mind – ready to react to a change in trend. As was discussed last week, the current U.S. recovery has acutely fallen short versus past recoveries, and one of the contentions on this blog is that this should continue for the foreseeable future. But every now and then, we do run into data that seems to question this thesis. Job creation is an example. Year-to-date, monthly non-farm job creation has averaged 220k. Since 2009, a year which lost an average 424k each month, job creation has been sub-par but has also progressively gotten better – from 88k monthly in 2010 to 174k in 2011 to 186k in 2012 to 194k in 2013. There are signs that the hitherto momentum this year will continue for at least the next several months. Job openings are at a healthy clip. Of course, these openings may never get filled or may even get withdrawn, but the intention to hire is there. This is something U.S. corporates have taken time to warm up to, as they have to capital spending.
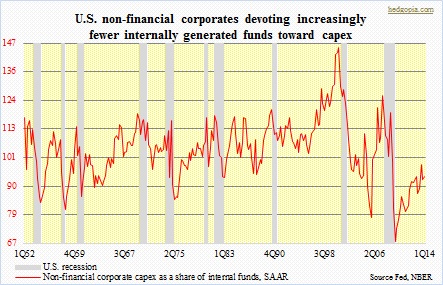
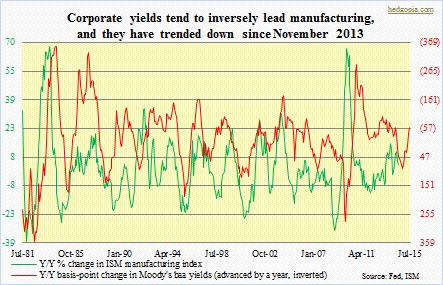
 As was discussed – and feared for – in the inaugural blog back in April, U.S. corporate capital spending has miserably failed to meet expectations. Businesses are more interested in so-called returning cash to shareholders –dividend payments and stock buybacks – than in building capital stock. But once in a while, we do confront data that seem to suggest otherwise. Here is why. Corporate yields tend to lead manufacturing. In the adjacent chart, year-over-year change in Moody’s baa yields has been advanced by a year, with the idea that a drop in yields now will have positive impact on manufacturing in subsequent months/quarters. There is indeed a tight correlation between the two. A lot of times, it is not the yield per se, but the change in yield that matters. The idea is that comparatively lower yields tend to spring corporate boards into action. In a normal cycle, interest rates grease the wheels of an economy. The only caveat this time around is that, thanks to the Fed, they have been kept artificially low. So what has held true in the past may or may not do so, as rates have stayed low for too long.
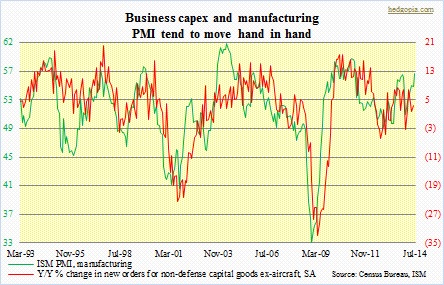
 Now on to the accompanying chart. Once again, the two series seem to go hand in hand, only this time the series are different – manufacturing PMI and y/y percent change in new orders for non-defense capital goods ex-aircraft, a proxy for corporate capex. PMI tends to lead capex by six to eight months. Hence if low corporate yields lead to firmer manufacturing activity, and this relationship holds, then the latter also has the potential to positively impact capex. Caveat emptor: once again, corporate boards are well aware that the prevailing interest rates do not reflect reality, are rather manipulated, hence possibility of continued risk-off attitude toward aggressively increasing capex. One more thing. More than 450 of the S&P 500 companies have so far reported 2Q14, and things are not that shabby on the sales front – up 4.3 percent y/y, versus 2.2 percent over the preceding four quarters. In a normal cycle, sales growth tends to lead corporate capex by one quarter, with emphasis on the word ‘normal’. Remains to be seen if corporate boards get tempted into opening up their wallets just going by one quarter’s sales number. After all, inventories contributed nearly half (1.66 percent) of the four-percent growth in real GDP in 2Q14. Month-over-month change in retail sales has been decelerating since April, and were nearly flat in July. So it is entirely possible that these inventories are – and will be – sitting on shelves. Time will tell.
Nevertheless, for now, it pays to be aware of the afore-mentioned relationships.

