
 Heard yesterday on Bloomberg Radio that U.S. consumption of boats and RVs is through the roof; RV sales are back to pre-Great Recession days, even as sales of boats are below that watermark but remain very healthy. These items tend to be highly discretionary. For sales to remain as good as they are, consumers have to be feeling good. Several factors could be causing this feel-good effect. The most important, of course, is earnings/wages. More on that later. We may also be seeing the so-called wealth effect making a positive contribution. Except for the Nasdaq, which is at the highest level since 2000, all major U.S. indices are at/near all-time highs. Equities have been on a relentless push higher since late-2008/early-2009 lows. There has been a lot of money made in stocks, and some of that wealth is probably getting splurged on such items. Last but not the least is the level of debt that consumers are willing to take on. On this front, there has been a surge in willingness. Seasonally-adjusted consumer credit – $3.2tn as of May – is nearly $600bn higher than pre-Recession days, and the share of non-revolving credit has surged to 72.7 percent from 61.7 percent in January 2008. Credit-card debt is a good example of revolving credit, while student and car loans are examples of non-revolving. So, yes, credit has definitely provided a boost to sales of boats and RVs.
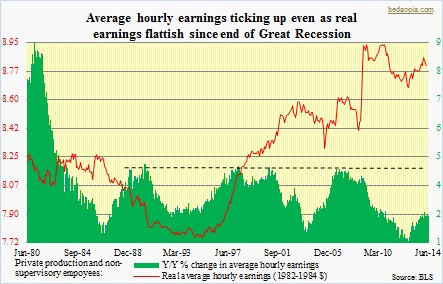
 Now on to the most important of all – earnings/wages. As the chart above shows, the current recovery on this front falls far short of what has been the case in the past. Going back nearly three decades, year-over-year change in average hourly earnings of production and non-supervisory employees (total private) has tended to peak at four-plus percent – 4.4 percent in June 1990, 4.3 percent in June 1998, 4.3 percent in December 2000, and 4.2 percent in December 2006. In the current recovery, it dipped as low as 1.3 percent in October 2012 and has since grudgingly moved higher, to 2.3 percent in June. It could mean one of two things – (1) there is much more life left in the economic recovery, and in due course earnings will catch up to historical trends, and (2) GDP growth has been sub-par throughout the five-year recovery, so it makes sense that employee earnings are sub-par too. Truly, real earnings have not made much progress – essentially flat from pre-Recession days.
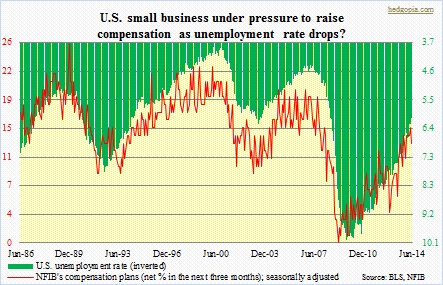
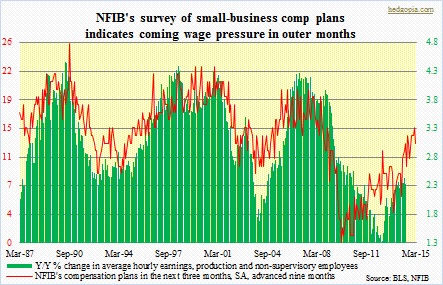 Given the age of the recovery and underlying weakness, it is hard to imagine y/y earnings begin to grow in the four-percent range. But then look at the middle chart. It plots the unemployment rate against the National Federation of Independent Business’s survey of compensation plans in the next three months. There is an interesting relationship. As the unemployment rate drops, businesses come under increasing pressure to increase wages. If forecasts are right – by both the Fed as well as mainstream economists – then unemployment should continue to decline in the months and quarters to come. In this scenario, wages accordingly will need to keep up. We have a similar message coming out of the accompanying chart. In this, NFIB’s ‘compensation plans’ has been advanced by nine months, and if its relationship with the afore-mentioned ‘y/y percent change in average hourly earnings’ is maintained, we are looking at continued strength in earnings growth. It is probably a little too early to buy into this thesis, but never say never. Fingers crossed.
