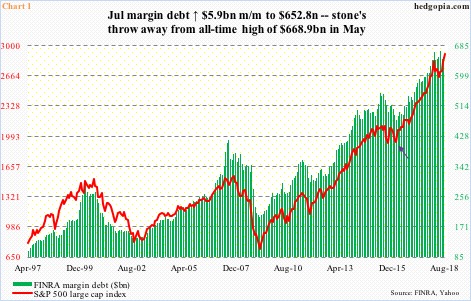
As US stocks continue reaching new – and newer – heights, margin debt continues to grow by leaps and bounds. Equity bulls are riding the debt wave, even as bears point to the suffering it will cause eventually.
FINRA (Financial Industry Regulatory Authority) margin debt rose $5.9 billion month-over-month in July to $652.8 billion, not too far away from the all-time high of $668.9 billion which was recorded in May. In January when US stocks toward the end of the month retreated for a quick double-digit decline into early February, margin debt reached $665.7 billion. These are massive numbers.
To get an idea about how it has grown over time, let us consider that in February 2016 margin debt was $474.2 billion. US stocks reached a major bottom back then. The S&P 500 large cap index bottomed at an intraday low of 1810.10 (arrow in Chart 1). This August, the index rose three percent m/m to 2901.52. Several other indices did much better last month, with the Nasdaq composite up 5.7 percent and the Russell 2000 small cap index up 4.2 percent. In all likelihood, margin debt continued to rise in August, if not made a new high.
Chart 2 uses a personal income measure to highlight how elevated margin debt currently is. The green bars represent margin debt as a percent of disposable personal income. The latter in July was $15.6 trillion, up 42.3 percent from June 2009, when Great Recession ended. Margin debt during the period surged 200.1 percent. Thus the persistently rising bars.
During the dot-com bubble, margin debt as a percent of disposable personal income peaked at 4.1 percent in March 2000. Then during the housing bubble/financial crisis, it peaked at four percent in July 2007. This January, both those prior peaks were surpassed, as the green bar rose to 4.4 percent. July was 4.2 percent.
This is way elevated – historically, of course – and this is what equity bears are focused on. Their argument that the buildup in margin debt is not sustainable is unassailable. When these things reverse, this will leave behind a lot of pain, as evident in how margin debt shrank once the prior two bubbles ended. But at the same time, what is to say it cannot continue higher?
In Chart 3, the Nasdaq composite is advanced by six months, and margin debt is calculated by using a 12-month rolling average. Then a year-over-year percent change in calculated in both. There is a correlation between the two. If this relationship holds, the green bars should bottom out in the latter months of the year and rise into the next. A rise in margin debt should bode well in a seasonally strong period. This argues for a bullish case.
Incidentally, it turns out, a rise – or a lack thereof – in margin debt can have implications for the overall economy as well. On a 12-month moving average basis, margin debt has shown a tendency to peak ahead of US banks’ commercial and industrials loans by about a year (Chart 4). In July, the green bar was $638.2 billion, a new high, and the red line $2.15 trillion, also a new high. On an absolute basis, C&I loans increased $17.2 billion m/m in July to a seasonally adjusted annual rate of $2.23 trillion. This metric is still going strong, although the red line went flattish for several months before breaking free in March. As things stand, the green line has not even started going flat, let alone roll over.
The rise in margin debt suggests investor willingness to borrow. On a broader macro scale, this is what is evident in C&I loans. As long as this continues, let the good times roll. At least this is how the bulls feel. The bears are salivating over the payback time, but they will have to wait for that – duration notwithstanding.
Thanks for reading!

