
Corporate buybacks were the savior last year, even as investors took cash out of equities and foreigners reduced exposure to US stocks. The status quo needs to change. Bulls cannot continue betting on continued buyback momentum.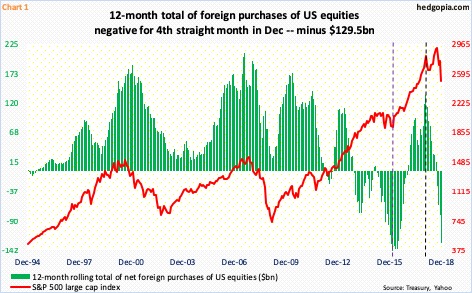
On a 12-month rolling total basis, foreigners began selling US stocks last September. Till August, they were buying $16.4 billion worth. Come October, they went negative. Early in that month, stocks began what soon turned out to be a cliff dive. By the time the S&P 500 large cap index bottomed on Boxing Day, it had lost just north of 20 percent. This, however, was not enough to entice foreigners back onto the long bandwagon.
In December, they sold $129.5 billion worth, which was the highest since May 2016. In that year, US stocks reached a major bottom in February, as foreigners sold a record $145.3 billion worth. Then they flipped. The green bars in Chart 1 began to rise (violet dashed vertical line). The timing was perfect.
This time around, foreigners began to get cautious early last year, with peak net purchases of $135.7 billion in January (black dashed vertical line). Late January, stocks came under severe pressure, bottoming two weeks later. But foreigners continued to reduce exposure. This may have changed this January, as stocks shot up in that month. We will find out when January’s numbers are reported Friday next week. This will be a big tell. Without foreigners on board, it will be difficult for bulls to build on the momentum they have enjoyed since late December.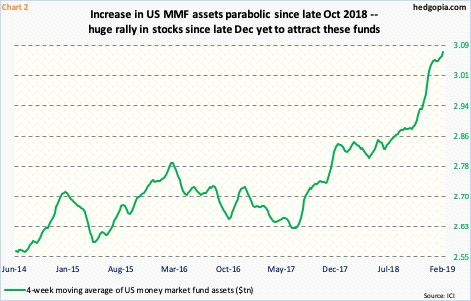
This is particularly so because cash continues to accumulate on the sidelines.
From when stocks bottomed 10 weeks ago through Tuesday, ETF.com data show, $21 billion collectively left SPY (SPDR S&P 500 ETF), VOO (Vanguard S&P 500 ETF), IVV (iShares core S&P 500 ETF), QQQ (Invesco QQQ trust), IJR (iShares core S&P small-cap ETF) and IWM (iShares Russell 2000 ETF). Similarly, since that low through the week ended Wednesday last week, US-based equity funds lost $14.9 billion.
Money-market funds continue to swell. In the couple of months since the week ended December 26, these assets went up by $40 billion. Chart 2 uses a four-week average, and the buildup has gone nearly parabolic since late October last year. As of Wednesday last week, these funds held $3.08 trillion. In the right circumstances, this can act as a big tailwind to stocks as money leaves these funds. But inability of the sharp rally this year to do so raises a question mark about the sustainability of the prevailing momentum. The longer investors wait in deploying their cash horde, the higher the odds of a retest of December lows in weeks ahead.
Recently, major US equity indices met with selling at crucial resistance – the S&P 500 (2771.45) at 2800, the Nasdaq 100 (7112.47) at 7100 and the Russell 2000 (1536.82) at 1600.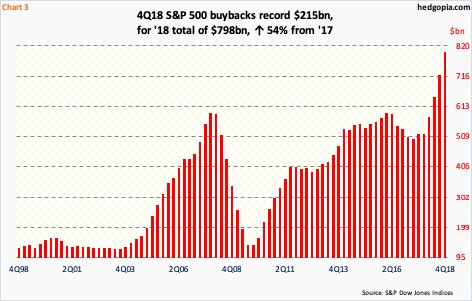
In this respect, how corporate buybacks behave can potentially make or mar things. Post-tax cuts of December 2017, 2018 was a bumper year.
Preliminarily, S&P 500 companies spent $215.4 billion in 4Q – a record – for a 2018 total of $797.9 billion, versus $519.4 billion in 2017. Nonetheless, the S&P 500 lost 6.2 percent last year. Makes you wonder how bad things might have gotten if not for these buybacks. They essentially offset shortfalls elsewhere. US-based equity funds lost $105 billion in 2018. Not to mention the aforementioned selling by foreigners.
Hence the question, will buybacks continue at the 2018 pace? Better yet, what if they don’t? Buyback activity is already at nosebleed levels. It is risky betting on continued momentum. Bulls either need the buyback status quo to continue or other sources of funds need to pick up the slack.
Thanks for reading!
