
Breakouts galore!
Three of the four major U.S. indices – the S&P 500 large cap index, the Nasdaq composite and the Dow Industrials – this week eked out new record close. The Russell 2000 small cap index is yet to join them.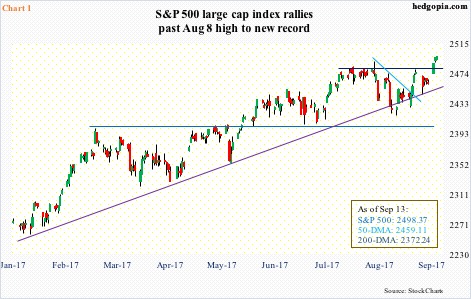
Intraday between August 8 and 21, the S&P 500 shed three percent. That decline did not even test support at 2380-2400 (Chart 1). Either the bulls were too impatient to let that happen or the bears rushed to cover, or a combination of the two.
For now, small-caps lagging behind their large-cap brethren is ammo to skeptics who doubt the durability of this rally.
This small-versus-large divergence notwithstanding, flows are cooperating with the bulls.
During the August 8-21 decline, SPY (SPDR S&P 500 ETF), VOO (Vanguard S&P 500 ETF) and IVV (iShares core S&P 500 ETF) together lost $3.9 billion. Since that bottom through this Tuesday, however, these ETF’s took in $9.6 billion (courtesy of ETF.com).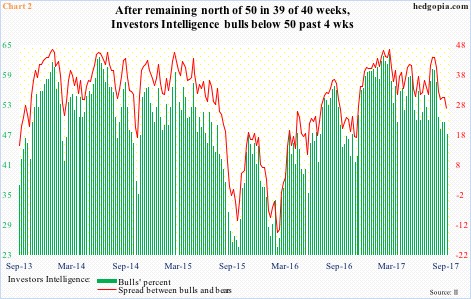
In the meantime, the skeptics now have something else they can point to.
The August 21 bottom in the S&P 500 coincided with a drop below 50 in Investors Intelligence’s bullish percent. For the week ended August 23, bulls declined 2.4 points week-over-week to 48.1, and remained sub-50 in the next three – 49.5, 49.5 and 47.1, respectively.
The sub-50 reading the past four weeks was preceded by readings of 50 or above in 39 of 40 weeks, nine of which were north of 60 (Chart 2). The latest reading of 47.1 is a 10-month low.
In the latest week, bears were 20.2 percent – the first time they exceeded 20 percent since late November last year – and have been inching up since 16.2 percent six weeks ago (not shown in the chart).
Should these newsletter writers begin to jump back on the bullish bandwagon, stocks likely get another shot in the arm, and build further on recent action.
Else, it is worth noting that the green bars in Chart 2 are dropping from an elevated level. In fact, as early as seven weeks ago, bulls were 60.2 percent. Ditto with the red line, which is a spread between bulls and bears – 26.9 in the latest week. If this persists, and both the bars and the line continue lower, this suggests newsletter writers are advising their subscribers to use the recent strength to cash in/lighten up.
Thanks for reading!
