
Up until recently, investor sentiment, as portrayed by Investors Intelligence’s weekly survey, was exceedingly bullish on U.S. stocks. Rightly so. The last time the S&P 500 Index had a 10-percent correction was in April-June 2012. (Although the September-October decline last year came close.)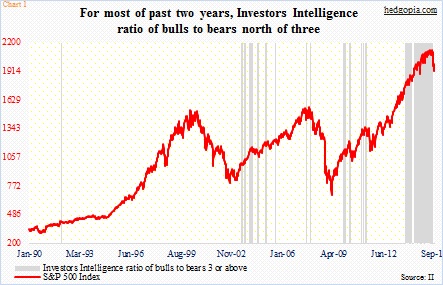
Chart 1 captures this giddy bullish bias well. The grey bars represent the weeks in which the ratio of bulls to bears has been three or above. In the past two years in particular, it is not even a contest. Bulls won hands down. The ratio persistently stayed north of three.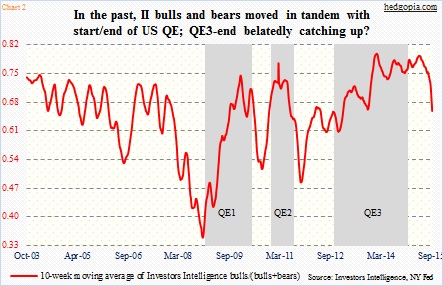
One can argue QE had something to do with it. The 10-week moving average of bulls/(bulls+bears) moved in unison with the start and end of QE, except bulls refused to back down as QE3 ended, as was the case with the first two iterations of QE (Chart 2). Now they have. The red line seems to be belatedly catching up with QE3-end.
In recent weeks, the drop in the bulls’ count mirrors that of the drop in U.S. stocks – waterfall-like. Between the May 20th high and August 24th low, the S&P 500 lost 12.5 percent. The real damage began on August 18 when the index lost 11.2 percent in five sessions! Not surprisingly, this took a toll on investor sentiment. In the August 11th week, bulls were 40.2 percent, and bears 18.6 percent. This week, they were 25.7 percent and 27.9 percent, respectively. As early as June 23rd, bulls were twice that (at 51.6 percent). We have to go back to the latter months of 2008 to find the bulls’ count as low as now (Chart 3). This would suggest a washout – a capitulation – has taken place.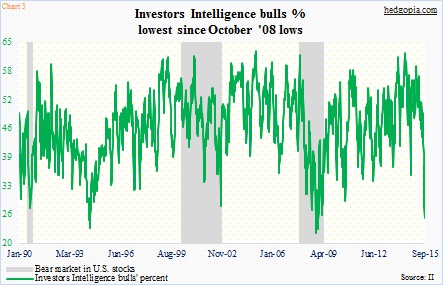
Except it is not yet confirmed by the bears’ camp.
Bulls may have thrown in the towel, but not the bears (Chart 4). Understandably, bears’ count was much higher during the last two bear markets. But versus now, they were also a lot higher during the 2010 and 2011 corrections. So in the right circumstances, there is room for the green line in Chart 4 to move up. This likely depends on whether or not the prevailing correction is over, or there is more to come. In the latter scenario, those in the correction camp should begin to thin out as they jump on the bear bandwagon. In the latest week, they made up 46.4 percent… have been in the 40s the past six weeks.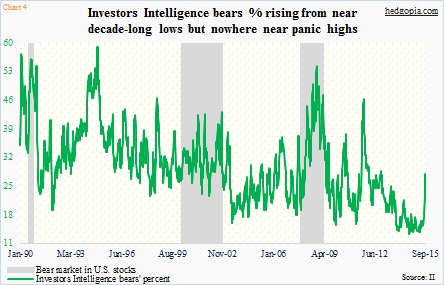
What are the odds of this happening? Decent, if we are to go by Chart 5, which pits the 10-week moving average of bulls/(bulls+bears) with bear markets in U.S. stocks. In the chart, there is also a line drawn at 0.67. Turns out this is an important number. Historically (going back 25 years), once the green line drops below 0.67 from above, more often than not it has a tendency to persist – regardless we are in a bear market or not. This week, the reading was 0.66. The last time it dipped under was in October 2013, when the reading stayed at 0.66 for two weeks, before snapping right back up (blue arrow). However, 2010 and 2011 – not to mention 2008 – were not so lucky (orange arrows). For that not to recur, bulls need to regain confidence. And fund flows need to improve – quick. Understandably so far, things are headed the wrong direction. Lipper told us yesterday that U.S.-based stock funds saw $16.2 billion in outflows in the August 9th week, versus inflows of $3.9 billion in the prior week. 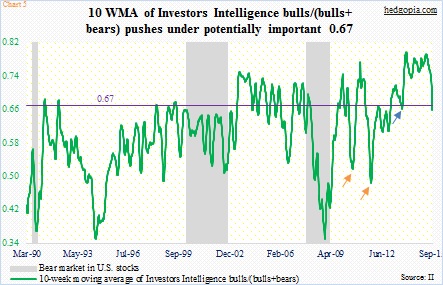
Thanks for reading!
