
- March 20, 2008: 114.1
- August 27, 2015: 112.6
- September 7, 2016: 112.0
On October 11, 2007, the S&P 500 large cap index entered a bear market peaking at 1576.09. It would not bottom until March 9, 2009 when the tape hit 666.79. But in between, there were powerful contra rallies, one of which began on March 17, 2008 when the index traded at 1256.98. By May 19 that year, the index stood at 1440.24, up 14.6 percent.
On March 20, 2008, the 21-day moving average of the ISEE index (all equity) bottomed at 114.1, rising to 170.2 by May 27 that year. This unwinding acted as a big tailwind for stocks.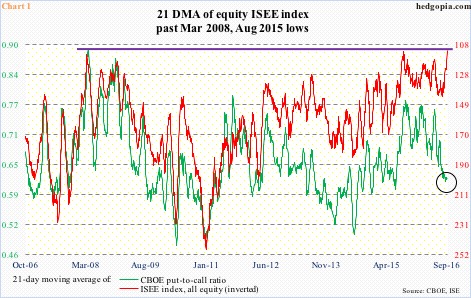
Unlike the CBOE put-to-call ratio, the ISEE index is a call-to-put ratio (hence inverted in Chart 1), and excludes trades from market makers and broker/dealers. As well, it only uses opening long trades. So from the perspective of sentiment reading, the latter is considered a clean number. Market makers, for instance, need to hedge exposure all the time. Retail traders on the other hand bet on direction.
Without question, the red line in Chart 1 flagged an important bottom in stocks in March 2008. This was followed by another in August 2015.
Peak to trough, between August 18 and 24 last year, the S&P 500 dropped from 2103.47 to 1867.01 for a five-session, 11.2-percent drop. On August 27, the red line in Chart 1 reached 112.6 before rising. Once again, this was an important signal to go long. The August 24th low in the S&P 500 was successfully retested on September 29. By November 3, the S&P 500 rallied 13.1 percent.
Fast forward to Wednesday this week, the red line in Chart 1 once again dropped to match the 2008 and 2015 lows … in fact, surpassed those lows by a whisker. Equity bulls for sure hope this ends up leading to an equity rally similar to what transpired in 2008 and 2015.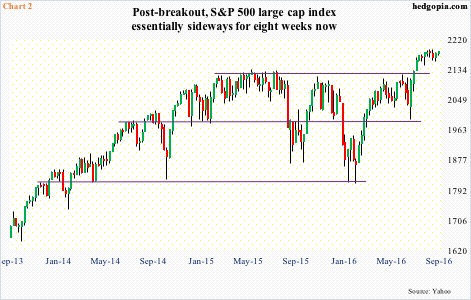
The S&P 500 has essentially gone sideways the past couple of months. On July 11 this year, it broke past the May 2015 all-time high. It was an important breakout, as the index had essentially been sideways since February 2015.
The current sideways action in the S&P 500 can very well be part of a continuation pattern. If so, the prior price trend is likely to continue. The bulls hope so. At least going by how the ISEE index is behaving, this seems like a likely scenario. But is it?
Here is a crucial difference between the lows of 2008 and 2015 and now. Back then, both lows preceded big drops in the S&P 500. Technicals were oversold, and they needed to unwind. Now, it is the opposite. The S&P 500 is a hair’s breadth away from its record high. Technicals are overbought – on essentially all timeframes.
Here is another.
Chart 1 also plots the 21-day moving average of the CBOE equity put-to-call ratio. Just about the time the ISEE index bottomed at 114.1 on March 20, 2008, the CBOE put-to-call ratio peaked at .89 on March 28. Similarly, later in 2015, it peaked on September 18 at .785. Both left plenty of room for unwinding. In other words, the CBOE put-to-call ratio and the ISEE index were moving hand in hand; now, the two have diverged, with the former already at .619 on Wednesday (circle in Chart 1).
One can think of a scenario in which the ISEE index begins to unwind its oversold condition – thereby helping stocks – and the CBOE put-to-call ratio follows along. In it, the CBOE put-to-call ratio continues to come under pressure. Indeed, historically, it has tended to bottom in mid- to high-.50s. But, given how overbought stocks are, it is a scenario difficult to put high odds on currently.
It is possible the red line in Chart 1 (1) begins to rise without putting upward pressure on stocks, or (2) continues lower, to new lows.
Thanks for reading!
