
ITB, the iShares Dow Jones U.S. home construction ETF, has rallied strong the past couple of months. From the February 11th low through the intra-day high yesterday, it jumped north of 30 percent, rallying past its 50- and 200-day moving averages as well as resistance at $26.50 (Chart 1).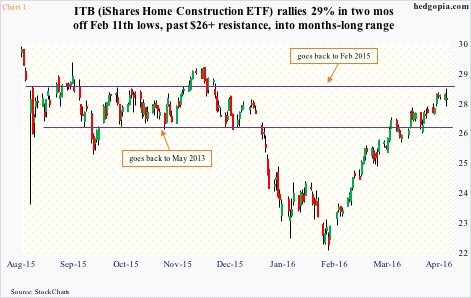
With the move, the ETF has dropped back into a range it has been in for well over a year now. In fact, yesterday it nearly kissed the upper end of the range – at $28 and change – before retreating.
In rallying off early-February lows to the current level, ITB has expended a lot of buying power/energy. During the period, it has pretty much followed U.S. stocks higher.
Short interest helped big time.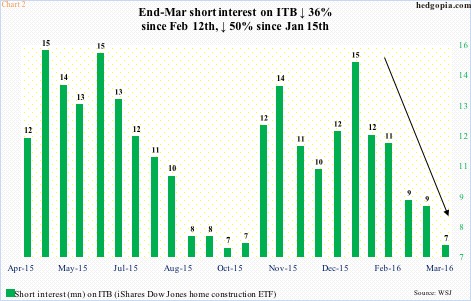
In the latest period, that is as of March 31st, ITB’s short interest dropped nearly 18 percent period-over-period, to 7.3 million shares. The ETF rallied 5.3 percent during the March 15-31 period. Go back to February 12th, and short interest declined 36 percent (Chart 2). This has gone a long way in contributing to the 30-percent rally in the ETF since February 11th.
This despite the fact that, since stocks began to rally on February 11th, and in this case ITB in particular, housing-related data have been tentative.
Sales of new homes were at a seasonally adjusted annual rate of 540,000 units in December, followed by 502,000 in January and 512,000 in February. Existing home sales were 5.45 million units (SAAR) in December, followed by 5.47 million in January and 5.08 million in February.
Similarly, housing starts were 1.16 million units (SAAR) in December, 1.12 million in January, and 1.18 million in February.
Incidentally, March’s housing starts were published yesterday, and were a big disappointment, down 8.8 percent m/m to 1.09 million units – a five-month low. Starts peaked last June at 1.21 million units – the highest since October 2007.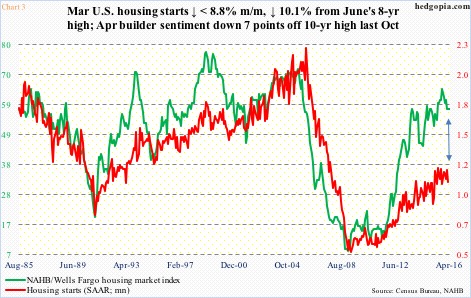
Chart 3 plots housing starts against the NAHB/Wells Fargo housing market index. Historically, they tend to track each other well, with correlation coefficient of 0.78 going back to 1985. This time around, the gap between the two is yawning.
Builder sentiment peaked at 65 last October, which was at a 10-year high. During the last three months – February through April – it has been stuck at 58. As stated earlier, housing starts peaked last June. If past is prologue, either the red line follows the green line higher, or vice versa.
Since that October 2015 peak, builder sentiment seems to have run out of steam. Their lesser interest in starts says it all.
This can have implications for Chart 4, which plots builder sentiment against ITB. They move in tandem – more or less – with correlation coefficient of 0.68 within the dates shown in the chart.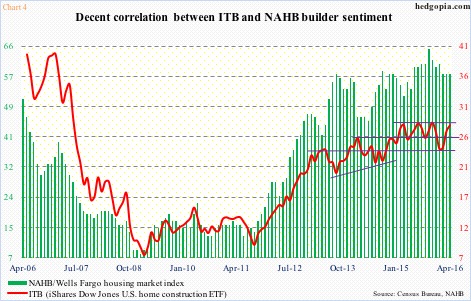
Back in November and December of 2014, builder sentiment stood at 58, which has also been a reading the past three months. Viewed from this perspective, sentiment has gone sideways for a long time. ITB ($27.66) – itself trading within a range – reflects that. (In Chart 4, yesterday’s intra-day high is used for April’s price point in order to show the significance of the resistance the ETF is currently bumping against.)
A breakout here would be massive. But odds are shrinking. Technicals are overstretched. Yesterday produced a long-legged doji, also tagging the upper Bollinger Band. At least in the near term, the path of least resistance is probably down.
For now, ITB looks shortable.
Thanks for reading!
