
ITB (iShares Dow Jones US home construction ETF) continues to search for direction. As did lots of other ETFs/indices/individual stocks, it fell drastically late January-early February. Unlike many others, however, recovery since has been tentative, to say the least.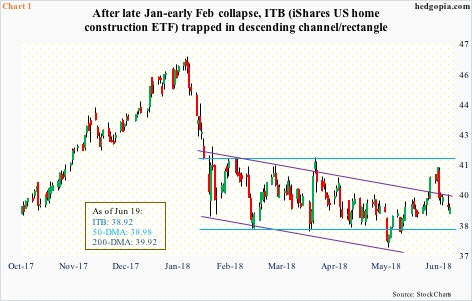
From an intraday low last August to an intraday high of 46.56 on January 24, it rallied nearly 41 percent in pretty much a straight line. The all-time high of 50.10 was reached in May 2006 – in the midst of the now-infamous housing bubble. For it to even manage to rally toward the bubble high, when home sales/starts were much higher, is nothing short of impressive. Then the bottom fell out. Sort of.
In merely 10 sessions beginning January 24, it collapsed 17-plus percent. Selling was not only limited to ITB, rather pervasive. Stocks everywhere took it on the chin. The difference is that most others rallied off of early-February lows. Not the least of which were the Russell 2000 small cap index and the Nasdaq 100 index. Both have rallied to new highs. The S&P 500 large cap index is still below its late-January high, but has made higher lows since the February low. ITB, on the other hand, did the reverse. Since that low, it has made lower lows and lower highs. It is now caught in a rectangle as well as a slightly declining channel (Chart 1).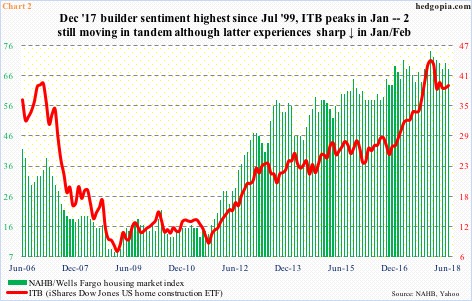
The January peak in ITB coincided with a multi-year high in the NAHB/Wells Fargo housing market index last December, when it peaked at 74 – the highest since 75 in July 1999. June was down a couple of points month-over-month to 68. Builder sentiment remains high.
Historically, ITB and sentiment have shown a tendency to move in tandem, except there has been a slight divergence of late. ITB followed the index lower in January, but the drop was sharper (Chart 2). It is possible the ETF is anticipating what might lie ahead, but thus far builders are putting money where their mouth is.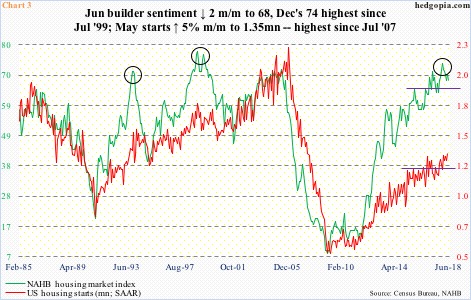
Chart 3 pits the NAHB index with US housing starts. In May, starts rose five percent m/m to a seasonally adjusted annual rate of 1.35 million units. In a larger scheme of things, this is far from excessive. During the bubble, the series peaked at 2.27 million units in January 2006. With that said, May produced the highest reading since July 2007. As a result, the yawning gap between starts and sentiment has narrowed of late, but only a tad.
In the past, whenever builder sentiment galloped ahead, in due course it reverted back to the mean. Once again, ITB could very well be in a process of pricing this in. Sales data corroborate this to some extent.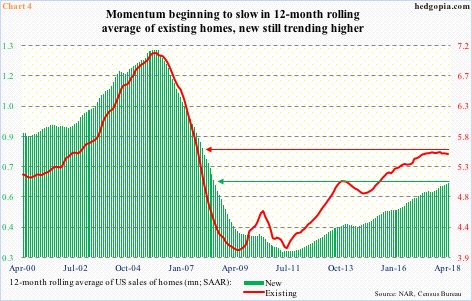
Sales of both new and existing homes are holding up. In 2005, they respectively peaked in October and September at 1.34 million units and 7.26 million units (SAAR). On a 12-month moving average basis, they both peaked in November that year, followed by a waterfall dive. After bottoming in 2011, sales recovered nicely. Last November, they both reached cycle highs – new homes 712,000 units and existing 5.72 million units, with April at 662,000 and 5.46 million, in that order. (May’s existing home sales are due out later this morning.)
A deeper look reveals a potentially disturbing trend in the making. Chart 4 uses a 12-month moving average, which can help identify a trend. On this basis, new home sales are still rising, but not the existing ones. If momentum does not pick back up soon, the latter is rolling over. Is this what ITB is focused on?
As things stand, the ETF is below both its 50- and 200-day moving averages, which it needs to recapture to establish a new uptrend. Both are within striking distance. Until then, it is bears’ ball to lose.
Thanks for reading!
