
- U.S. home builder sentiment chirpy, near multi-year highs
- Just a matter of time before sentiment follows home sales/starts lower
- Stocks follow builder sentiment; ITB perilously close to breaking crucial support
Hope springs eternal. U.S. home builders are an optimistic bunch. The National Association of Home Builders/Wells Fargo housing market index printed a preliminary 57 for January. A stone’s throw away from September’s 59, which was the highest since 61 in November 2005. Back then, things were hot and heavy in housing. In the thick of a bubble. So for builders to be as optimistic as they are now, they have to be feeling pretty good.
Yes and no.
Sentiment is chirpy. No denying that. Home builders’ optimism probably focuses on the 5.6 percent national unemployment rate, on healthy corporate profits, on rising stock market, on lately soaring consumer confidence, among others. They hear and read what you and I hear and read on TV and in newspaper – that 2015 is the year the U.S. economy generates enough velocity to escape the doldrums. All this good news has to translate into rising sales of homes. They want to be bullish.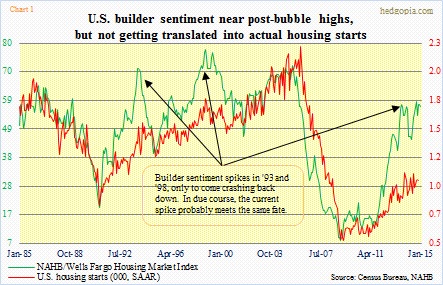
Nonetheless, thankfully, they are not putting money where their mouth is. Chart 1 shows the divergence between builder sentiment and housing starts. The latter has lagged the former by a wide margin. And that has been a smart thing to do. Home sales are still tentative. Yes, unemployment is low, but the employment to population ratio is a dismal 59.2 percent. Yes, non-farm payroll has surpassed the pre-crisis high, but 93mn people are not in the labor force. Yes, corporate profits are high, but wages are stagnant. And on and on.
So kudos to home builders for not going crazy about new construction. Given soft sales, one can imagine what that would do to the inventory situation. Already, the ratio of housing starts to new home sales is at a fairly high level (Chart 2).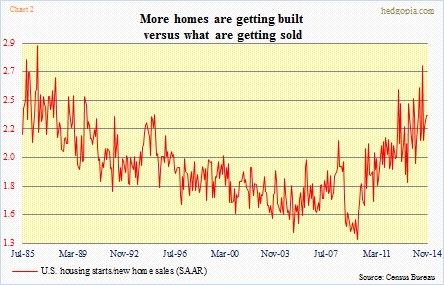
This is beginning to impact home builders’ results. Investors did not quite like what they heard out of both KBH and LEN when the companies reported 4Q14 last week. Gross margins took a hit due to increasing construction costs. Moderation in pricing power also pulled down KBH’s margins. LEN too faced moderation in pricing power due to an increase in labor, material and land costs. The latter expects gross margin this year to be around 24 percent, versus 25.4 percent last year. KBH expects margin to be lower than 20 percent.
The pricing dynamics are noteworthy as home price has had a huge recovery (Chart 3). The median price of an existing home rose to as high as $222k in June last year, and has since receded to $205.3k in November. Back in July 2006, price peaked at $230.4k. Things are even better in new homes. The median price has surpassed the bubble high. November was $280.9k, just under $291.7k in August last year. Clearly, price has risen too much too fast. Interest rates are not a problem. The 30-year Treasury yield made an all-time low just last week.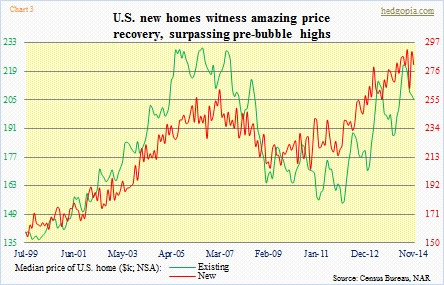
Builders for sure would like fundamentals to catch up with their sentiment, but history has shown us time and again that in due course gravity rules (arrows in Chart 1). As far as investors are concerned, they follow builder sentiment (Chart 4). And that is a problem.
Of the two major home building ETFs – XHB and ITB – the latter is much more concentrated. The top 10 accounts for 62 percent of total assets. DHI, LEN, PHM, TOL, NVR, TPH and RYL – all builders – comprise 51 percent. HD, LOW and SHW – housing-related but not builders – account for 11 percent. In XHB, the top 10 only comprise 33 percent of total assets. In the top 10, TOL, TPH, MDC, PHM and RYL – home builders – only make up 16 percent. The other 16 percent is accounted for by LL, AAN, OC, WHR and LOW.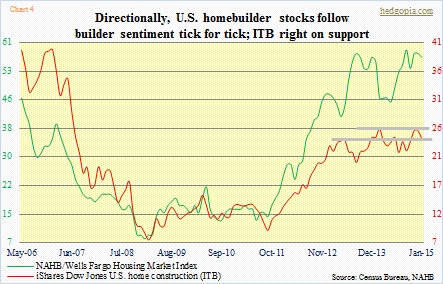
ITB provides a much larger exposure to home builders.
Technically, the 26-plus level has proven to be a tough nut to crack (Chart 4). Post-financial crisis, the ETF first reached that level in May 2013. By the way, the chart does not show that, as it uses a monthly close. That high was revisited in February last year and again this month. In a monthly chart, momentum indicators such as the MACD and RSI have consistently made lower lows corresponding to each of those peaks. Real trouble for longs begins when price slices through 24. The way it is looking now, it is not a matter of if, rather when that happens.
