
Next week’s economic calendar is housing-heavy.
Monday brings the NAHB/Wells Fargo housing market index for July, Tuesday housing starts for June, and Thursday existing home sales for June.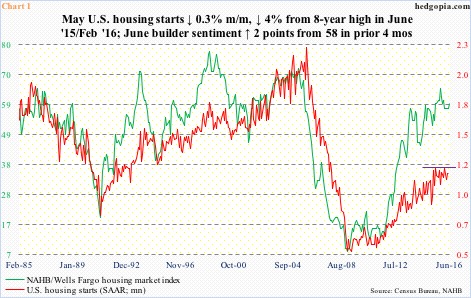
Builder sentiment remained stuck at 58 for four months through May, before rising two points in June to 60 (Chart 1). This was still below 65 in October last year – which was a 10-year high.
Sentiment has come a long way. It dipped to as low as eight in January 2009.
Ordinarily, housing starts tend to move in lockstep with builder sentiment. Makes sense. It is the builders and how they feel about future demand that will decide how aggressively they break new ground. Since the two bottomed in the early months of 2009, directionally, they have moved together, but at the same time the gap between the two has widened (Chart 1).
May housing starts were essentially flat m/m – down 0.3 percent to a seasonally adjusted annual rate of 1.16 million units. Starts reached a cycle peak 1.21 million units in June last year, which was matched this February. That high was the highest since October 2007.
Looking at Chart 1, the question is if starts rise to meet builder sentiment or the latter drops to meet the former. Starts went sideways for nine months through February this year before weakening in the next three.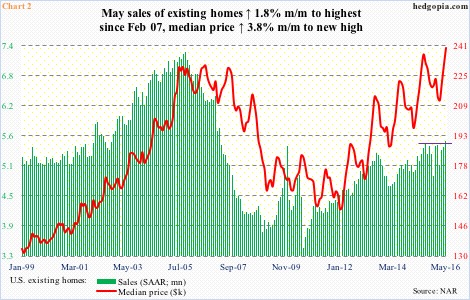
Existing home sales are the same way. Just about. May sales rose 1.8 percent m/m to a seasonally adjusted annual rate of 5.53 million units, which was the highest since 5.79 million units in February 2007. That 5.53 million was not that far away from 5.48 million in July last year. Once again a case of flattish behavior.
Ironically, amidst this consolidation pattern seen in existing home sales, the median price managed to rise to an all-time high $239,700 in May. This, in and of itself, can be a limiting factor for sales.
Is this the reason why builders sound optimistic in surveys but are not ready to put their money where their mouth is when it comes to building new homes?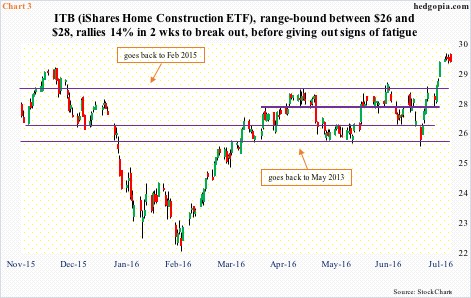
Within these dynamics, and heading into next week’s release of these three data points, a lot has been priced into ITB, the iShares US home construction ETF.
The ETF, range-bound between $26 and $28 for a while, broke out a week ago (Chart 3). Post-Brexit, off the June 27th intra-day low, it rallied 14 percent in two weeks, pushing daily momentum indicators in particular into deep overbought territory.
There are signs of fatigue showing up on the daily chart.
Importantly, unlike in the early months this year, short interest is no longer a tailwind. It dropped from 14.7 million in the middle of January to 7.5 million by the end of June. The ETF bottomed on February 11th, and the persistent decline in short interest was a big help in the subsequent rally. In the latest period, short interest rose 11.1 percent period-over-period, but remains suppressed (Chart 4).
Put it all together, and ITB ($29.16) looks like a ripe short candidate. Having just broken out, at least a breakout retest is probably in the cards near term.
Thanks for reading.
