
Even though trade tensions particularly between the US and China have heated up, small-caps – supposed beneficiaries of a trade war – have stalled of late. Medium term, downside risks are huge. In the very near term, it is a toss-up – kind of range-bound. An iron fly fits the bill.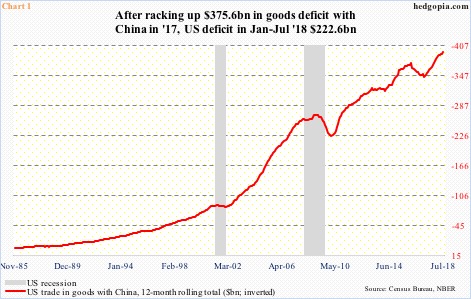
In July, the US racked up $36.8 billion in goods deficit with China – a record. This was made up of $10.3 billion in US exports and $47.1 billion in imports. This nothing but helps add fuel to the ongoing US-China trade-tension fire.
On a 12-month rolling total basis, since Donald Trump was elected US president in November 2016, US goods deficit with China has grown by $46.3 billion to $393.5 billion. In 2017, the deficit was $375.6 billion. Year-to-July, it already totals $222.6 billion.
As tensions heat up, both China and the US have imposed tariffs on $50 billion of each other’s goods. Last Friday, President Trump said his administration was ready to impose tariffs on an additional $267 billion in Chinese goods.
Earlier when the tariff talk was at its incipiency, small-caps rallied on investor perception that because of their domestic focus they remain immune – or get hurt less – from trade disputes. If we are to buy into this logic, the new round of US tariffs should yet again light a fire under small-caps. Currently, they have stalled.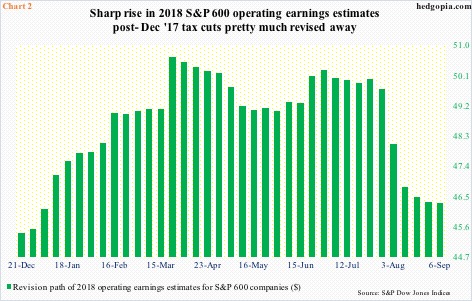
Post-US presidential election, small-caps rallied on the back of another similarly perceived tailwind. This time, the argument was that – once again because of their domestic focus – these businesses would inherently benefit more from tax cuts than their large-cap brethren. As a result, earnings estimates shot up.
The Tax Cuts and Jobs Act of 2017 was signed into law on December 22. A day prior, 2018 operating earnings estimates for S&P 600 companies were $45.41. Then they surged, peaking at $50.66 three months later. As of last Thursday, estimates were down to $46.30, meaning much of the upward revision post-tax cuts got revised away. This is not so for S&P 500 and 400 companies. For the former, 2018 estimates currently are $157.76 versus a peak of $158.24 as of July 26; for the latter, they are $103.94 versus a peak of $106.66 as of May 3.
In essence, small-caps, which were supposed to benefit the most from tax cuts, have borne the brunt of the downward revision in 2018 earnings estimates. Next year’s is intact. For the S&P 600, consensus estimates currently stand at $61.22, having peaked at $61.63 as of June 29. But that is the nature of the game. The sell-side notoriously starts out optimistic and gradually lowers the numbers as time passes. Next year’s estimates are vulnerable, given the direction 2018 is going.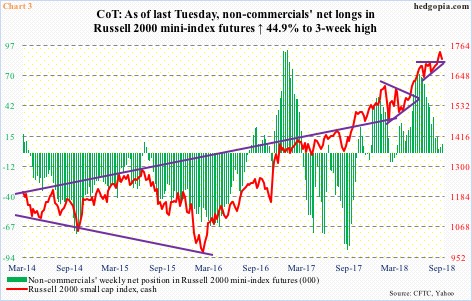
Arguably, non-commercials are anticipating this scenario. Back in February this year when US stocks bottomed these traders stayed net short Russell 2000 mini-index futures for four weeks. In the week ended February 13, net shorts peaked at 8,345 contracts. Four weeks later, they shifted to net long. By May 29, net longs were 74,239. They could not have ridden the rally in the cash any better (Chart 3). Then they began to cut back. As of last Tuesday, they only held 8,372 net longs.
More often than not, non-commercials tend to be trend followers. The trend in the Russell 2000 small cap index/IWM (iShares Russell 2000 ETF) has stalled – if that. In fact, they began going sideways on June 20. IWM hit an intraday high of $170.20 in that session. This level resisted breakout attempts for two more months before it was taken out 13 sessions ago (Chart 4). Shortly afterwards, the ETF peaked at $173.39.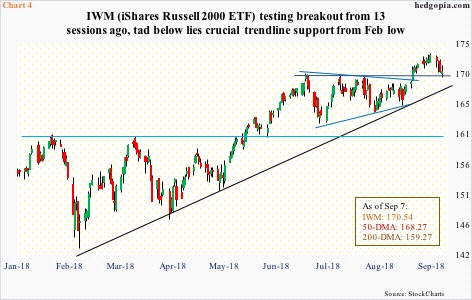
Last week, IWM ($170.54) shed 1.4 percent. Bulls managed to defend retest of the aforementioned breakout. A rising trend line from February this year is right underneath – as a matter of fact, the two will converge in a few sessions. The 50-day moving average ($168.27) is not far behind. In sum, as far as the bulls are concerned, this is a must-hold range. Medium term, IWM remains grossly overbought, with the ETF on the verge of a potentially bearish MACD cross-under. Near term, because it is so close to the aforementioned support, it is a close call. This probably creates opportunities near term for those wanting to play a range. In the options market, an iron butterfly probably fits the bill.
IWM long Sep 21 iron fly:
- Long 173 call at $0.65
- Short 170.50 call at $1.81
- Short 170.50 put at $1.56
- Long 168 put at $0.83
Hypothetically, a long iron butterfly expiring in the next two weeks with the above strikes results in a credit of $1.85. We can look at the setup as a combination of a bear call spread and a bull put spread. Another way of looking at it is it combines a short straddle with a long strangle. It is a non-directional spread. The wings are 2.50 points away, so $0.65 is at risk. Breakeven is at $172.35 and $168.65.
Thanks for reading!
