
- Large speculators in Russell 2000 futures showing aggression, net shorts highest since June 2011
- IWM short interest gradually on decline since end-July, stock seems to find support at 110
- Too early to say support will hold medium-term, but a trade is developing near-term
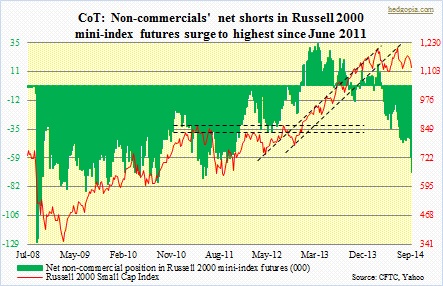 Non-commercial futures traders are really getting aggressive with their bearish bias in Russell 2000 mini-index futures. They are now net short 71k contracts, the highest since June 2011. In the last two weeks during which net shorts have gone up by 38k, both longs and shorts have done their share. The former reduced positions by 10k contracts, even as the latter raised theirs by 18k. So it is a double whammy. Sentiment is beginning to look a little toppy here. Interestingly, in August, when the IWM rallied six-plus percent (following a nearly nine-percent drop in July), equity shorts were either locking in profit or getting squeezed out. Short interest dropped from 173mn at end-July to 141mn at mid-September. While this reduces the odds of a squeeze, hence of a sharp reflex rally, this also points to a situation in which short-selling no longer pushes the price down. In other words, unlike their cousin in the futures market, shorts on the underlying are getting less aggressive. This can of course change. We will find out this Friday, which will reflect position as of Tuesday. On Wednesday, Thursday and Friday last week the IWM was trying to stabilize. Importantly, the ETF (111.12) has so far found support at the crucial 110 level (it is not seen in the chart since it uses closing price). Short-term technicals are way oversold, so a reflex rally is possible – even probable. A quick trade could be developing here. While it is too soon to declare this is a medium-term bottom, for reasons described below, and others, the probability of a short-term bottom has risen. The pre-open weakness this AM very likely will be bought as the day progresses. IWM 111 puts expiring this week were selling for $1.05 last Friday and will probably add another 0.20-0.30 cents by the time trading opens. I might sell those.
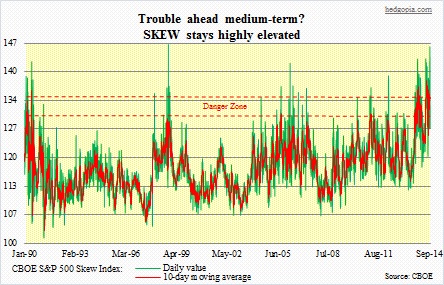 The CBOE S&P 500 Skew Index continues to stay elevated. On the 18th and 19th this month, there were back-to-back readings in the 140s – 142.1 and 146.08, respectively. The reading on the 19th is second only to the all-time record of 146.22 on October 16, 1998. It is rare to have readings that high. In 1998, the S&P 500 Index peaked in July, and by August had dropped 20 percent. Fear was pervasive. Investors were preparing for even worse, which is what is reflected in that record October reading. Stocks went down a little bit more, before bottoming that very month. Then we had another 140-plus reading in March 2006 (142.02), preceding an eight-percent-plus May-June correction. Fast forward to now, and including one in December last year, there have already been seven 140-plus readings in the past one year. The December 20, 2013 reading of 143.26 preceded a six-percent-plus January-February correction. Then we had one in June and three in July, and that preceded a four-percent-plus, two-week drop that began late July. Rather eerily, the September 19th reading came on the same day the S&P 500 Index posted its intra-day all-time high (2019.26). Subsequent to that, equities did drop two-percent-plus, and are already seeking to reflex-rally. Indeed, when Skew readings are this high, investors have probably hedged themselves whenever possible, but this would also mean that since these people are expecting worse would be hesitating to dip-buy too soon. This would imply that more weakness lies ahead in the medium-term. But in the very near-term, the odds of a reflex rally have risen.
