
For a while IWM, the iShares Russell 2000 ETF, lagged other major U.S. indices.
The ETF, as well as the Russell 2000 index are still below their respective August 17th highs, which preceded a five-day, 11-percent cliff dive (Chart 1). In the subsequent rally, other indices, such as the S&P 500 index, the Nasdaq 100 index, and the Dow Industrials surpassed their mid-August highs.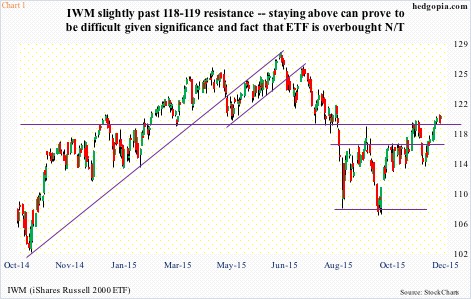
Currently, stocks in general are in the midst of a seasonally favorable period – historically speaking. Thanksgiving just ended, and Christmas is right ahead. More often than not, sellers tend to go on strike during this time of the year, and stocks levitate on low volume.
If this scenario is repeated this year, odds favor small-caps get bid up in hopes of a catch-up trade. This time of the year, beaten-down names become popular.
In fact, this phenomenon could already be unfolding.
Between the November 16th intra-day low and November 30th high, IWM rallied nearly six percent. During the period, both the S&P 500 and the Dow Industrials rose less than four percent, and the Nasdaq 100 less than five percent. The mid-caps, also a laggard, rose nearly five percent.
Those who bought small-caps in the latter half of November are obviously hoping they got in early, and that the rally continues. That may or may not happen.
The trend in flows is not very encouraging. Since the week ended September 30th, a total of $11.7 billion has flown into U.S.-based equity funds – decent but nothing to write home about. In the week ended last Wednesday, inflows were $2.9 billion, essentially offsetting the outflows of the prior two weeks.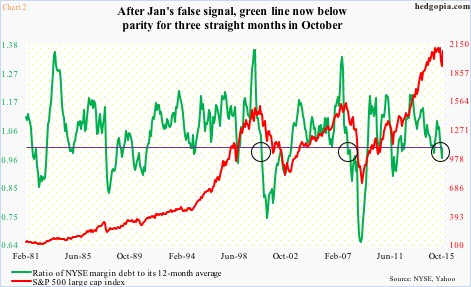
The rather lukewarm inflows mirror the sentiment reflected in NYSE margin debt, which rose $18 billion in October, reversing three straight monthly declines, but are down $35.3 billion from April’s all-time high. As a result, the ratio of margin debt to its 12-month average has stayed below parity for three straight months (Chart 2). Historically, once the green line sustains below one, that has meant bad news for stocks. That said, from bulls’ perspective, the line is not that far away from parity, and can easily turn back up if margin debt begins to rise.
But that is assuming/expecting a lot.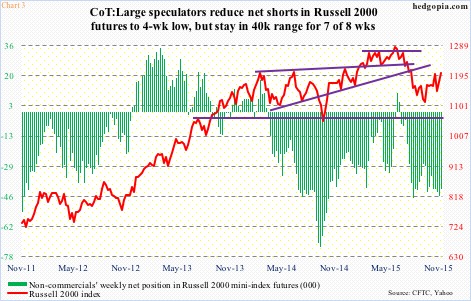
At least this is not a scenario envisaged by non-commercials, who continue to stubbornly stay bearish in Russell 2000 futures. In the latest reporting period, they reduced net shorts by eight-plus percent, but holdings have been in the -40,000 range the past five weeks. The rally since September 29th in particular has not shaken their bearish conviction.
There is one condition these traders might be tempted to cut back further… if IWM (119.89) succeeds in staging a breakout.
The ETF is at a crucial stage technically. The 118-119 range has been like a magnet since March last year – sometimes support sometimes resistance. Most recently, it failed at that resistance in early November, and is at it again. On Monday, it tagged the 200-day moving average, only to get rejected hard. The 0.7-percent rally yesterday once again puts the ETF right underneath that average.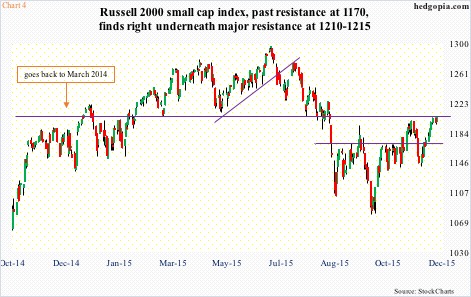
On the Russell 2000 (1204.16), the 200-DMA (1214.28) approximates the March 2014 horizontal resistance. In other words, it is yet to be cleared (Chart 4). Although IWM is slightly past that hurdle.
Daily technicals remain overbought. And in the latest push higher, bulls have expended a lot of energy already.
The combo of 200-DMA and the March 2014 resistance can create a roadblock – at least in the near-term.
This likely creates an opportunity for nimble IWM shorts – preferably through options. Hypothetically, December 4th 120 calls bring $0.72. It is a naked call, so will effectively go short at 120.72 if assigned. The 200-DMA is at 120.11. If the ETF stays under the strike in the next three sessions, the premium is kept. With three sessions left before expiration, that is the idea.
Thanks for reading!
