The January barometer is not boding well for US equity bulls. That said, they can take solace in the fact that the maxim’s record is poor when January is down versus when it is up. Besides, the first five sessions were up this year. Plus, not all major US equity indices were down last month.

The January barometer is predicting a down year this year. The adage posits that as goes January so goes the year. Although the track record of a down January, which is the case this year, is mixed.
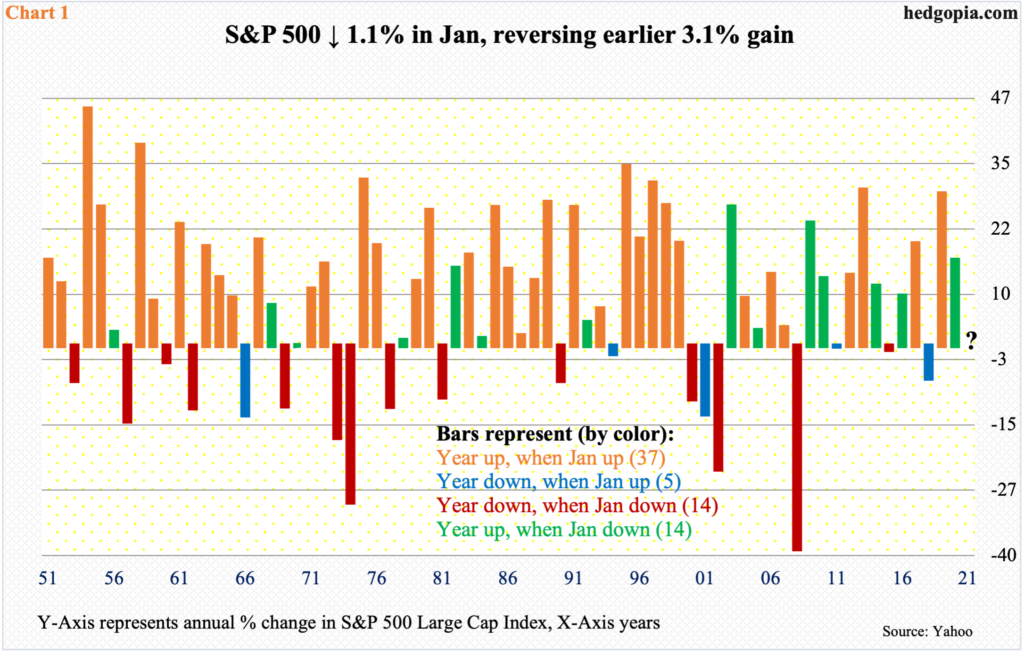
Chart 1 plots the annual returns for the S&P 500 going back 70 years, to 1951. The year 2021 is marked with a question mark. The data is divided into four buckets: (1) years that were up when January was up, (2) years that were down when January was up, (3) years that were down when January was down, and (4) years that were up when January was down. In parenthesis is the number of years corresponding to each bucket.
It turns out the barometer’s success rate is very high when the month is up. Out of the 70 years, there have been 42 years in which January was up. Out of those 42, the index went on to have a positive year in 37 of them; only five were down.
January was down in 28 of the 70, of which 14 ended up for the year and 14 down – essentially a coin toss. This year, markets got off on a high note. Until the 26th, the S&P 500 was up 3.1 percent, before offers began overwhelming bids. By the time the month was over, it was down 1.1 percent.
January unfolded similarly last year. Through the 22nd, the month was up 3.3 percent, but ended down 0.2 percent in the end. But the January barometer failed to live up to expectations as the year was up 16.3 percent.
Last year, January was not weak across the board. The Dow Industrials and the Russell 2000 Small Cap Index were down one percent and 3.3 percent respectively, but the Nasdaq Composite rallied two percent. Major indices diverged this year as well, with the Dow down two percent but the Nasdaq Composite and the Russell 2000 were up 1.4 percent and five percent respectively.
Further, the five-day rule, which maintains that if the S&P 500 rallies in the first five sessions the year will end up as well, was positive this year, as was last year. This year, the index was up 1.8 percent, versus a rise of 0.7 percent last year.
So, even though the January barometer bodes ill for equity bulls, they can take solace elsewhere, including: (1) the track record of a down January is mixed, (2) the S&P 500 rallied in the first five sessions, and (3) other major equity indices were up in January.

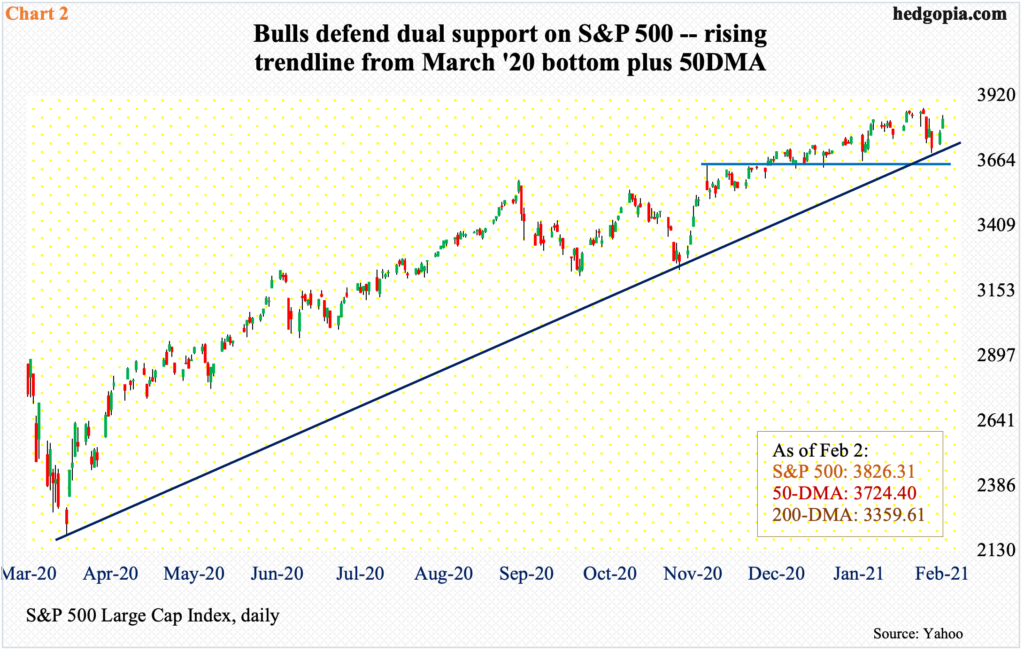
Of note, at the end of January, the S&P 500 landed right on dual support: (1) the 50-day moving average and (2) a rising trend line from last March when the index put in a major low (Chart 2). As far as bulls were concerned, the support was a must-save. The Nasdaq 100 and the Russell 2000 ended last month on similarly important levels (more on this here).
Thus far, with two sessions in, bulls have put their foot down, rallying the S&P 500 both Monday and Tuesday, up three percent week-to-date – merely 1.2 percent from the intraday record high set on the 26th last month.
As far as the S&P 500 is concerned, 2021 may have started with a down January, this is not spilling over to February – just yet.

Amidst all this, it is important to point out that this is not a cheap market by any stretch of the imagination.
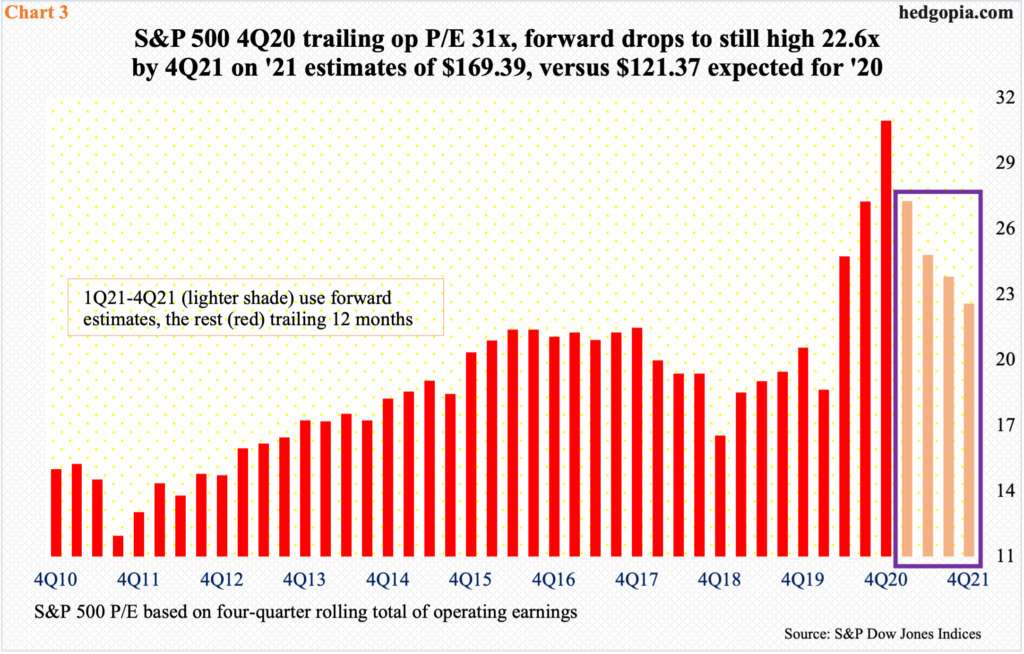
On trailing 12 months, the S&P 500 at the end of last year traded at an exorbitant 31x operating earnings (Chart 3). If 4Q estimates come through, these companies would have earned $121.37 last year. This year, however, optimism remains very high, with the sell-side modeling in $169.39, for growth of 39.6 percent! If these estimates are met, the P/E multiple drops to 22.6x, but this is still not cheap.
If multiples end up playing a role in the months/quarters ahead, the January barometer may very well end up correctly predicting the year. If bulls continue to overlook valuations, which they have done for a while now, the odds of 2021 being an up year are as good as being down.
Thanks for reading!

