
January was up strongly this year. For the believers of the January barometer, this means an up year – or at least the odds are heavily stacked for that outcome. Nevertheless, the fact remains that a sticky inflation could throw a monkey wrench into all this. Right here and now, no matter how the year ends, the S&P 500 is ready for a bounce.
After dropping 19.4 percent last year – a first down year since 2018 – the S&P 500 began 2023 with a bang. January was up 6.4 percent. Investors widely believe that as goes January so goes the year. The so-called January barometer’s record when the month is up is strong.
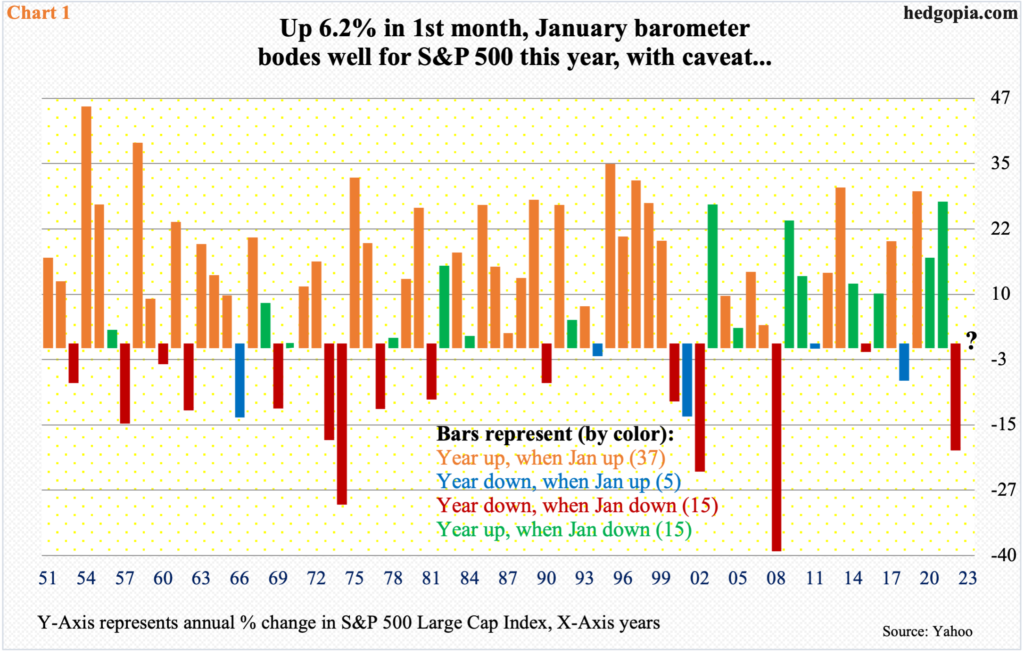
Chart 1 plots the annual performance in the S&P 500 going back to 1951 – for a total of 72 years. The data is divided into four buckets: (1) years that finished up when January was up, (2) years that finished down when January was up, (3) years that finished down when January was down, and (4) years that finished up when January was down. The number of years corresponding to each bucket are put in parenthesis.
Evidently, it turns out the maxim’s success rate is strong when January ends in the green. Out of the 72, this occurred 37 times; there were only five years that ended down with an up January. This constitutes a success rate of 88.1 percent when January is up. In contrast, the record of a down January is mixed right down the middle, with the year ending up or down 15 times each, which is nothing but a coin flip.
The barometer thus bodes well for the bulls this year. The only caveat is that the Federal Reserve/inflation/interest rates crosscurrents are too strong this year and an unexpected curve ball is always possible.
Consumer inflation is trending lower but remains high for the central bank’s taste.
January’s PCE (personal consumption expenditures) will be out this morning. In the 12 months to December, headline and core PCE grew five percent and 4.4 percent. They respectively peaked last year at seven percent and 5.4 percent in June and February, in that order. The Fed targets two percent on core PCE, which is a long way off. A sticky inflation has the potential for a higher-than-expected terminal rate. Besides, in the futures market, traders continue to expect the fed funds rate to peak between 525 basis points and 550 basis points by June (from the current range of 450 basis points to 475 basis points) and for the Fed to possibly begin to ease later this year.
A Fed that ends up being more hawkish than the markets expect can create problems for the bulls – at least the ones that bought aggressively in January.
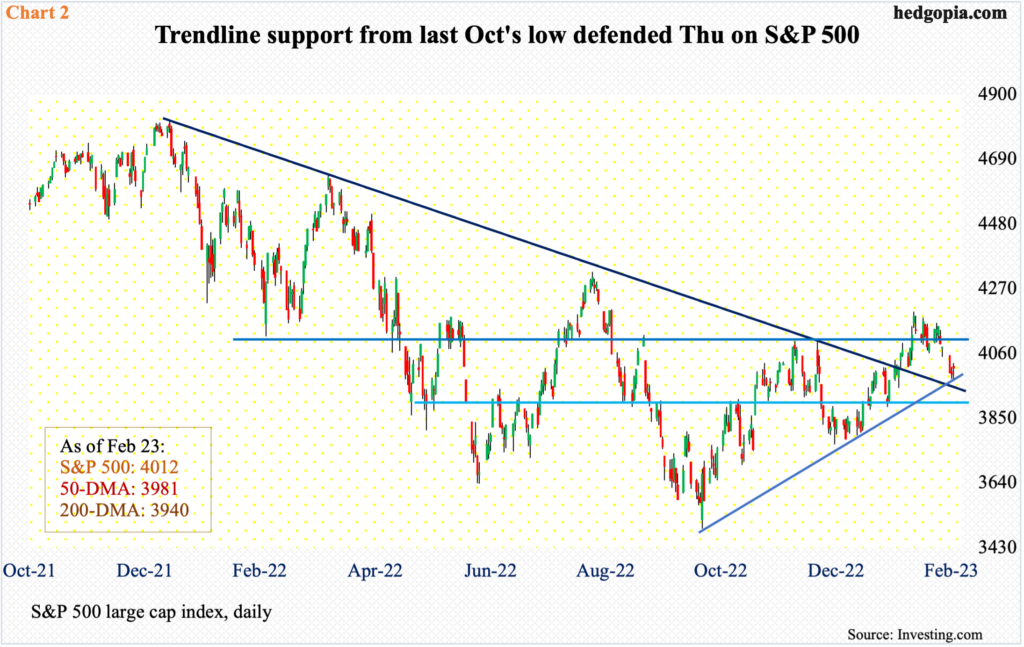
Having started out strong, the S&P 500 began to wobble early this month. From last October’s low through the February 2nd high of 4195, the large cap index rallied 20.2 percent before weakening. On its way to that high, the index broke out of 4100 in that very session, but the bulls were unable to hang on to it.
The downward pressure that followed probably reached an important low on Thursday – good enough for a decent reflex rally. Rising trendline support from last October’s low was tested as the S&P 500 ticked 3969 intraday yesterday, closing at 4012; the session low fell right between the 50- and 200-day moving averages (3981 and 3940 respectively). A bounce is due – regardless if the January barometer holds true or not this year.
If it turns out the PCE report comes out strong this morning and stocks sell off, the weakness probably gets bought for now.
Thanks for reading!
