
One look at Chart 1, and it is hard to notice a significant change in momentum behind the U.S. high-yield debt market. Through July, issuance totaled $188.4 billion. Annualized, 2015 is on track to issuing north of $300 billion – fourth straight year with a three handle. The red bars in the chart have persistently risen since 2008 lows.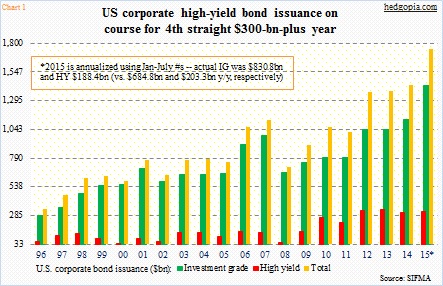
Several FOMC members keep hinting that they would like to hike rates this year – should economic data cooperate. A rate hike may or may not happen, but as far as corporate treasurers are concerned it is safe to lock in these historically low rates while they can. Markets are forgiving right now.
However, if we look at how bonds are behaving, not all is well in the junk land. JNK, the SPDR High Yield Bond ETF, peaked in September last year, made a lower low in May this year and has been under pressure the past couple of months (Chart 2). Last week the 50-day moving average crossed below the 200-day – a technical development known as a death cross.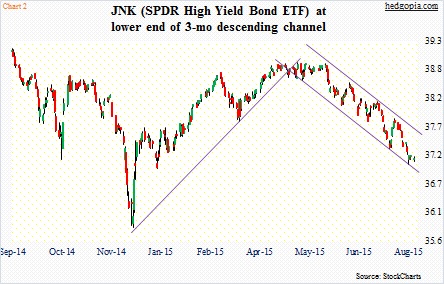
JNK began to lose momentum even as the West Texas Intermediate crude, unable to take out resistance at $62-$63/barrel, began to go sideways before falling out of bed early July (Chart 3). Energy makes up about 15 percent of the high-yield market.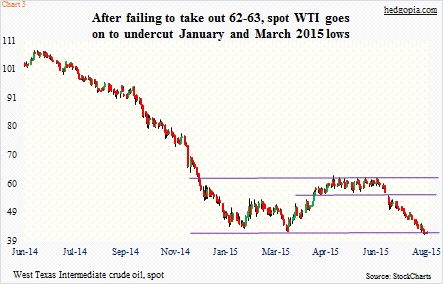
Last week, spot WTI took out January and March lows of this year. There is nervousness in the air as to where price might be headed. For oil bears, there is no shortage of data to feast on. Chart 4 highlights the issue relating to both production and inventory of crude.
U.S. production peaked at 9.61 million barrels a day in the June 5th week. Inventory peaked at 490.9 million barrels in the April 24th week. Since those highs, they have respectively dropped north of two percent and south of eight percent. In a larger scheme of things, the drop is miniscule. Production has doubled in the last decade, and really started spiking the last four years. Inventory jumped by 25 percent in the past year alone.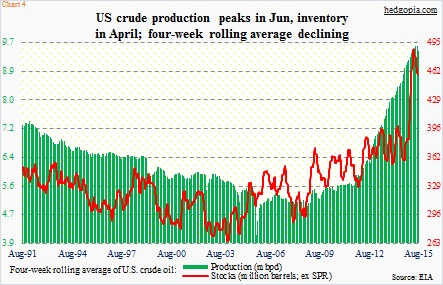
Come October, bank lenders will be performing a biannual review of the loans and revolving credit they have extended to exploration & production companies. The renewed drop in the price of crude does not help. Banks lend using reserves in the ground as collateral. The longer crude stays low, the more pressure they come under to restrict lending standards.
In some ways, this is beginning to get reflected in the high-yield market. As refers to Chart 1, July only saw $7.4 billion in issuance, down from $38.3 billion in March. It has been a gradual drop – $37.8 billion in April, $33.3 billion in May, and $21.2 billion in June.
This data point probably does not help brighten up the moods of investors who are already taking a cautious approach toward high-yield debt. On JNK, shorts have been gradually building positions. Short interest jumped from 16 million in mid-April to just under 37 million by the end of June. Since that high, it dropped in the next two periods, but remains relatively high (Chart 5).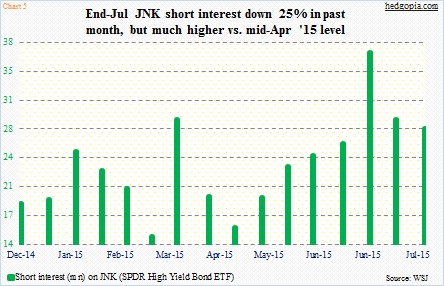
Investor caution is also reflected in Chart 2. In the past three months, JNK ($37.13) has traded along a declining trend line, bouncing up and down within a channel. Currently, it is at the bottom end of that, and trying hard to stabilize near the lower Bollinger band. Conditions are grossly oversold. As long as it does not undercut the recent low, a relief rally is possible – toward the upper end of the channel – especially if oil catches a bid.
But medium- to long-term, there is risk. In other words, yes to a trade but no to an investment.
Thanks for reading!
