
Equity traders have adopted a defensive posture since early November, even as large-cap equity indices went on to post newer highs. The likes of the S&P 500 are now catching up to it.
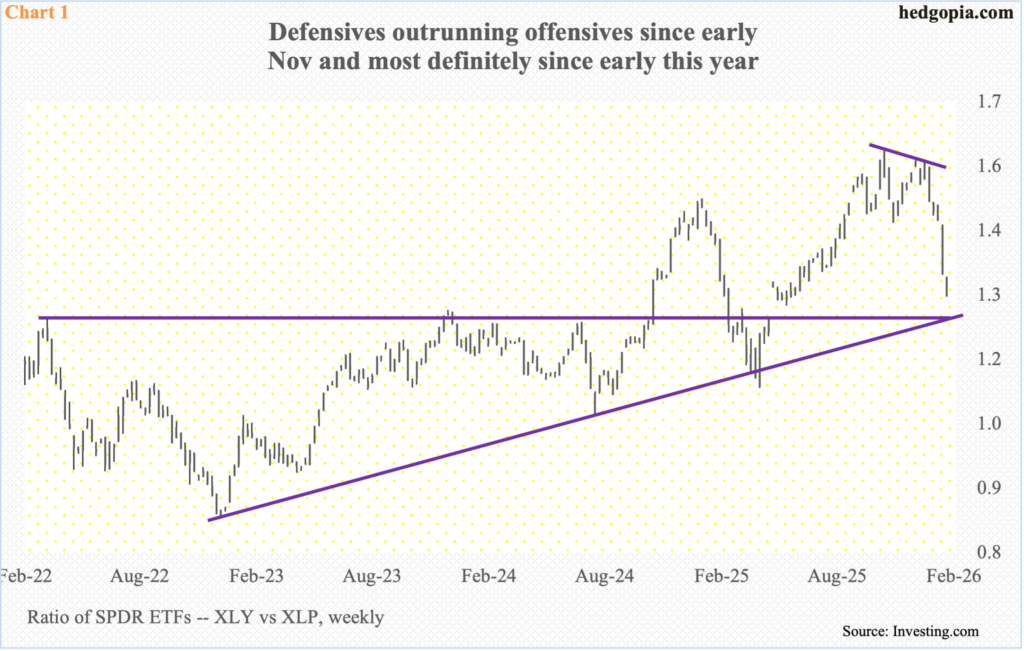
The ratio of XLY (SPDR Consumer Discretionary ETF) to XLP (SPDR Consumer Staples ETF) peaked on 3 November (last year) at 1.62; for comparison, the S&P 500 did so three trading sessions before that on 29 October. After dropping for three weeks, the ratio then made a lower high of 1.59 on 7 January (Chart 1), even as the large cap index proceeded to take out its October high and post newer highs.
Since XLY:XLP made that lower high last month, the ratio has essentially come undone, coming under persistent pressure and losing both the 50- and 200-day moving averages. Deeply oversold, the ratio (1.298) is approaching crucial horizontal support at 1.28, which also lines up with trendline support from early 2023. This is a must-save for risk-on trading.
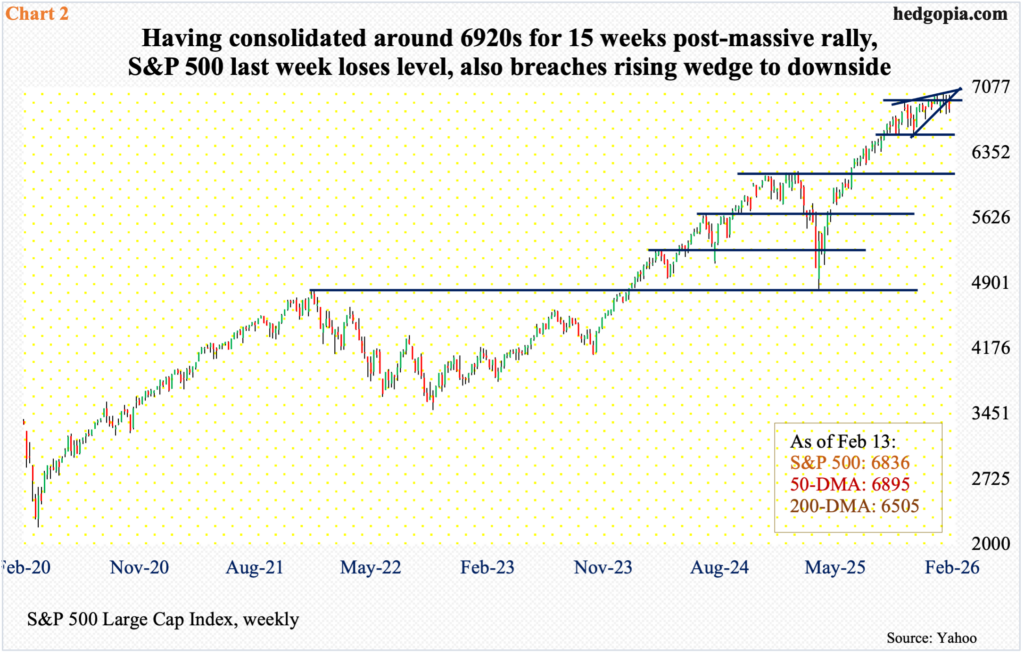
The S&P 500 went on to post a new all-time high of 7002 on 28 January before coming under slight pressure. But even here, the large cap index had essentially gone sideways since late October; on the 29th that month, it hit 6920 and reversed lower, bottoming at 6522 on 21 November. In the rally that followed, it trudged higher – to newer highs – but only to essentially straddle 6920s for 15 long weeks (Chart 2).
The sideways move followed a massive rally from last April when the index bottomed at 4835.
Last week, the index gave back 1.4 percent to 6836. In the previous four weeks, the weekly produced three spinning tops. Similarly, on the monthly, January’s spinning top followed December’s spinning top and November’s hanging man; with nine sessions to go this month, February is down 1.5 percent.
It is beginning to look like the S&P 500 is beginning to catch up to a lagging XLY versus XLP. The 50-day (6895) is beginning to turn lower, albeit ever so slightly; the average was breached last Thursday. The S&P 500 was also caught in a rising wedge, a pattern that has a reputation of breaking to the downside; the index fell out of it last week.
Bears are probably sensing an opportunity here. Decent opportunity should await them once bulls fail to defend 6770s.
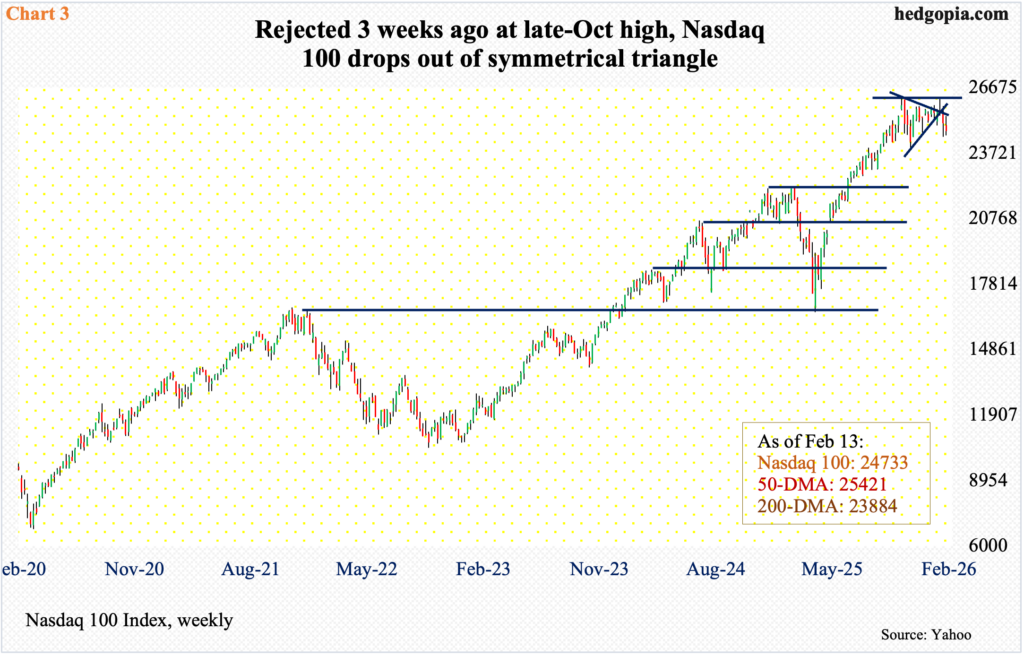
The Nasdaq 100 similarly has dropped out of a symmetrical triangle originating from 29 October when it reached a high of 26182. From 16542 on 9 April through that high, the tech-heavy index surged 58 percent.
Three weeks ago, on 28 January, bulls rallied the index within 17 points of the October peak and were rejected (Chart 3). For nine trading sessions now, the Nasdaq 100 has been under the 50-day (25421), which seems to be in the early stages of rolling over.
The 200-day rests at 25421, and a test seems imminent at some point. Signs of fatigue have been there for a while now. Both January and December produced a monthly doji, which followed November’s hanging man.
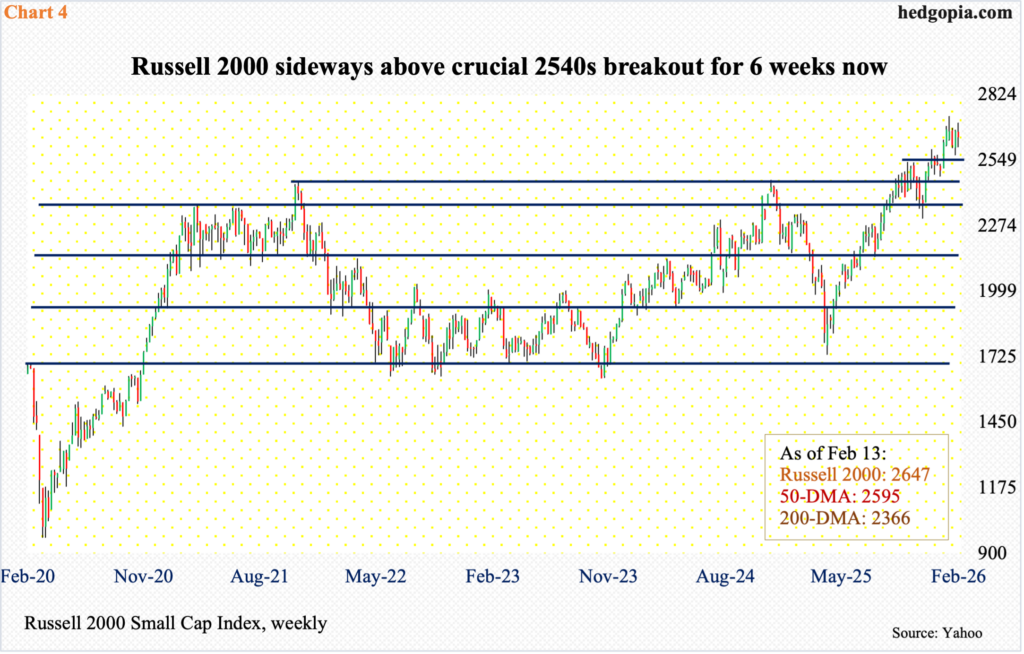
Small-caps are showing subtle signs of divergence with their large-cap brethren. As opposed to the S&P 500 and Nasdaq 100, the 50-day on the Russell 2000 is rising, as is the 200-day.
Last week, the small cap index declined 0.9 percent to 2647 but not before coming within less than 29 points of its all-time high 2735 posted on 26 January. On Tuesday and Wednesday last week, it tagged 2704 and 2706 respectively.
That said, for six weeks now, the Russell 2000 has trodden water above a crucial breakout point. Six weeks ago, it broke out of 2540s, which was just about retested two weeks ago (Chart 4). In the week in which the index tagged 2735, a weekly shooting star formed; last week, a weekly spinning top appeared. Bulls are struggling at 2700, but the Russell 2000 does remain above 2540s, not to mention another crucial level at 2460s.
In other words, small-caps are holding up better than large-caps that seem ready to finally take a cue from the underperforming XLY.
Thanks for reading!
