
It is too soon to say if last week’s rally was primarily the result of short-covering. It may be, but the fact remains that equity bulls did defend important support. A relief rally was due given the fact that the major indices were down a decent amount from their recent highs.
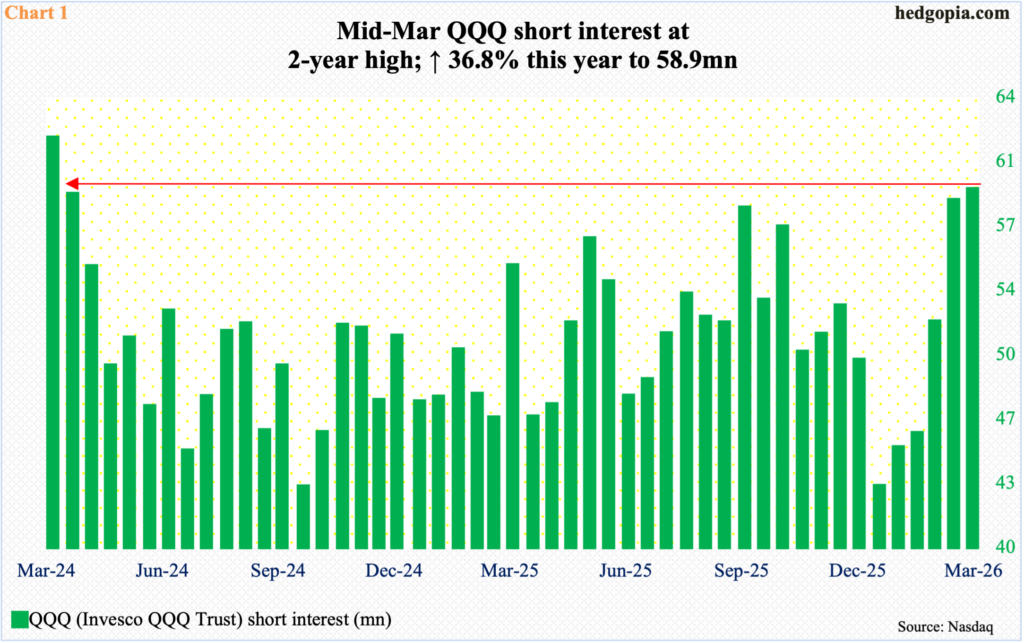
Ahead of the late-March low in the ETF, QQQ (Invesco QQQ Trust) short interest hit a two-year high mid-March (Chart 1). At 58.9 million, short interest has persistently risen since December-end last year when it hit a 15-month low 43 million.
This rising trend of bearish bias is in line with how short interest in the major equity indices is behaving. Mid-March, Both NYSE and Nasdaq short interest hit a new high, respectively at 20.7 billion and 20 billion (not shown here).
It is too soon to say if last week’s rally in QQQ, or the Nasdaq 100, is only the result of short-covering. In recent weeks, shorts were consistently adding, and the tech-heavy index was taking it on the chin. From this standpoint, shorts were doing very well, and locking in at least some gains would make sense.
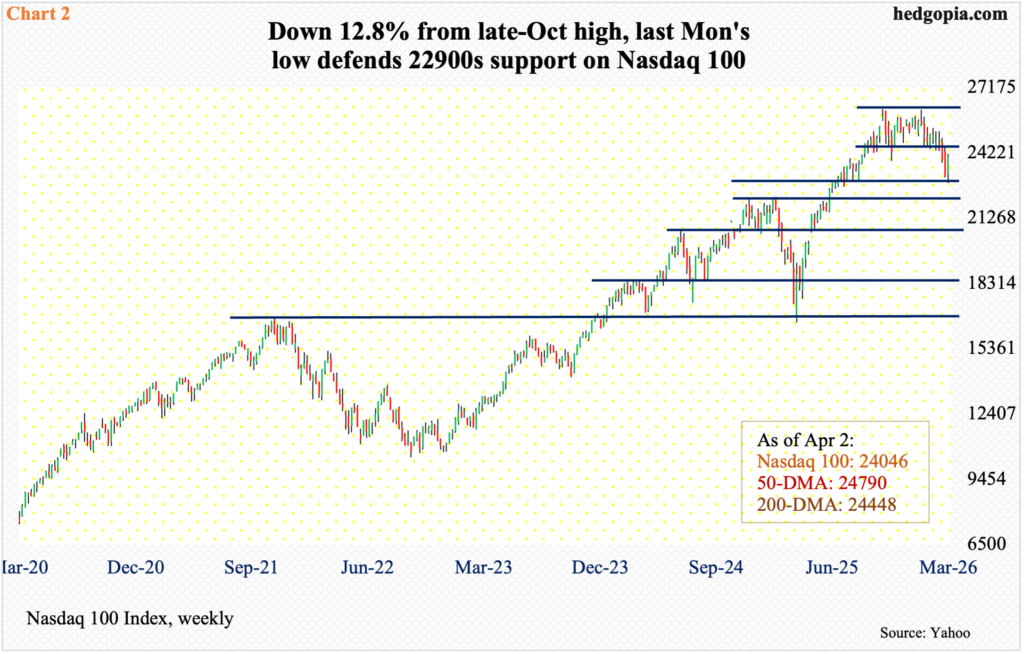
Last week, the Nasdaq 100 rallied four percent to 24046, bottoming on Monday at 22841; through that low, it was down 12.8 percent from the all-time high 26182 recorded on 29 October. Selling accelerated after tech bulls’ breakout attempt on 28 January fell short by 17 points (Chart 2). Going into last week, the index had been down in eight of nine weeks.
Last Monday’s low represented a slight breach of horizontal support at 22900s, but in the end it held, essentially closing right at short-term lateral resistance; should this get taken out, the path to the 200-day moving average at 24448, which also lines up with straight-line resistance at 24400s, opens up.
From bulls’ perspective, the good thing is that they were able to defend support on Monday.
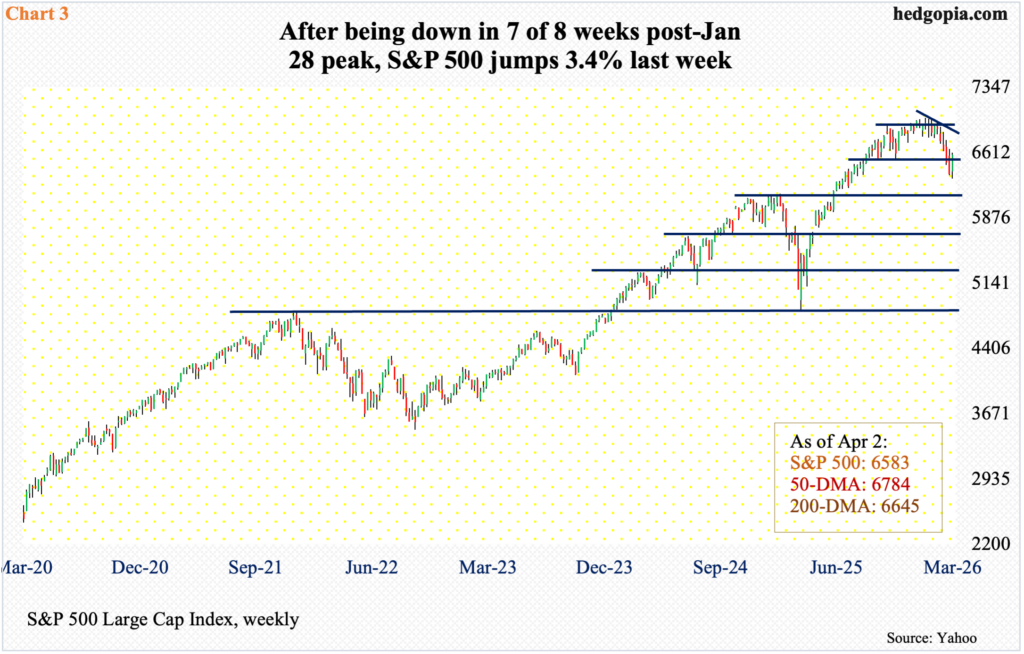
This was also true with the S&P 500, which from the all-time high 7002 posted on 28 January through last Monday’s low 6317 was down 9.9 percent before bids showed up. By the end of the week, the large cap index was up 3.4 percent for the week to 6583. This was the first up week in six – and second in nine (Chart 3).
Come Thursday, which was the last trading session in a holiday-shortened week, the index was down 100 points in the opening minutes, but only to attract consistent bids as soon as resistance-turned-support at 6470s were tagged; the session ended in the green by seven-plus points. It can be argued that short-covering helped, as shorts exited locking in paper profit. Bulls’ mettle will be tested at dual resistance ahead – horizontal at 6630s and the 200-day at 6645.
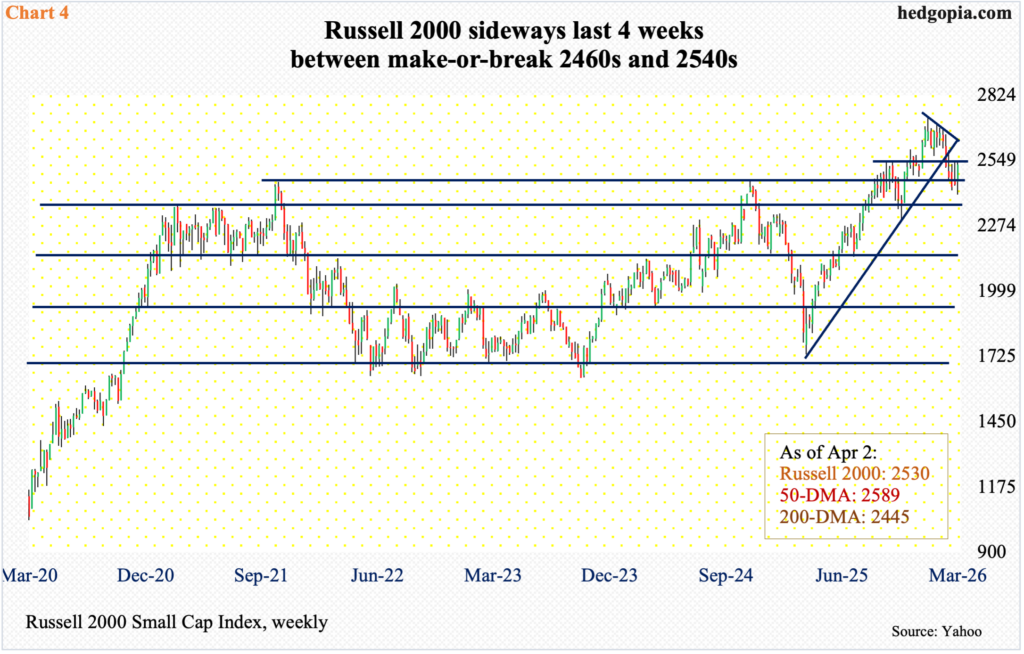
Small-cap bulls, too, put their foot down last week after initially facing a breach of breakout retest at 2460s. The week opened with Monday’s intraday low of 2405, but only to progressively rally toward Thursday’s close of 2530.
The significance of 2460s goes back to November 2021 when the Russell 2000 rose to 2459 and then reversed lower. Three years later, in November 2024, it retreated after ticking 2466. Last September, those highs were surpassed, but not before a stretched bull-bear tug of war followed around those highs (Chart 4).
Kudos to the bulls for defending this crucial support, rallying the index 3.3 percent last week. At the same time, they have consistently been denied a takeout of 2540s. Last week’s was the fourth week in a row small-cap bulls were denied at this hurdle, with the weekly high of 2541 coming on Wednesday.
Earlier, the Russell 2000 peaked at 2735 on 22 January, before making a series of lower highs. That trendline resistance gets tested around 2590s; the 50-day at 2589 lies around there as well.
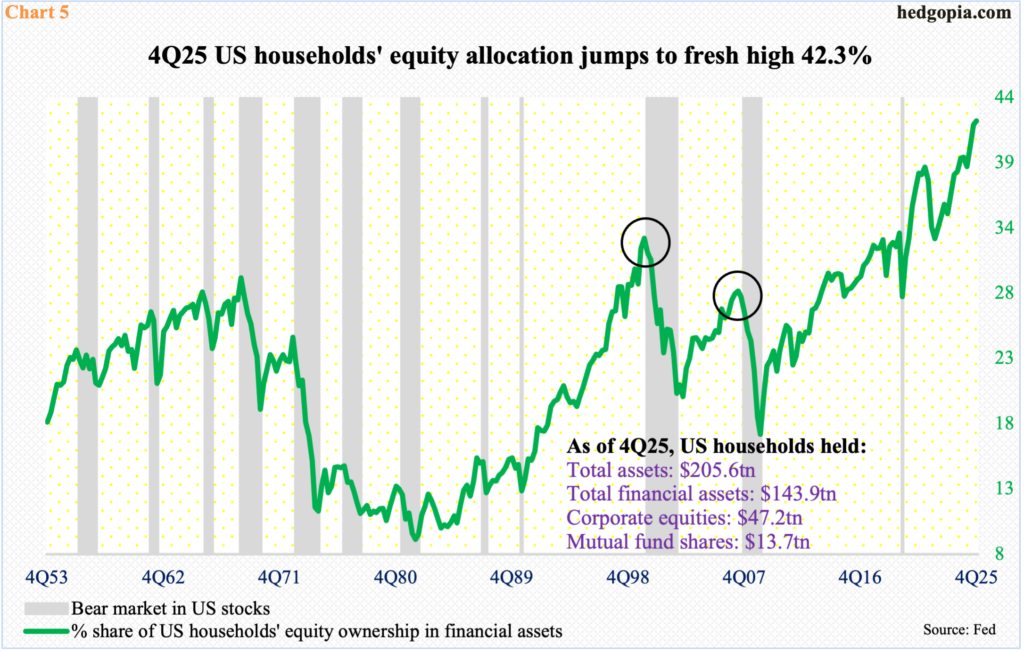
The latest weakness in equities has come at a time when several metrics are at/near historical levels. One such is households’ equity allocation, which set a new high in 4Q25. At 42.3 percent, the metric has gone straight up since the 1Q25 low of 38.6 percent, and more so since the 3Q22 low of 32.9 percent (Chart 5). Both these dates represented major lows in equity indices. The S&P 500 bottomed at 3492 in October 2022 and then at 4835 in April last year.
The current equity allocation is much, much higher than the bear market highs of 1Q00 and 3Q07 (black circles in chart). We are in uncharted territory.
The major equity indices peaked well ahead of the February 28 attack by the US and Israel on Iran, but they have remained under pressure as the conflict has dragged on. Amidst this comes last week’s rally in hopes of a resolution, and which likely was helped along by shorts who covered.
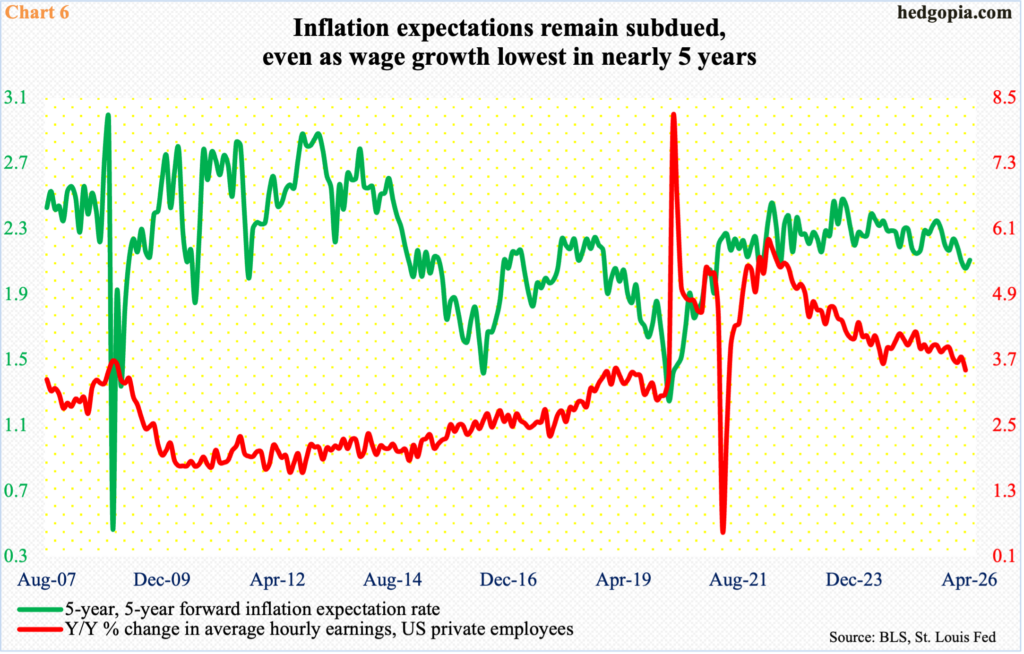
The danger in all this is that the uncertainty persists, and the rise in energy prices begins to filter through to the economy. The sharp rise in gasoline prices is yet to result in heightened inflation expectations but is hitting households at a time when wage growth is decelerating. In fact, private employees’ average hourly earnings in March grew 3.5 percent from a year ago to $37.38, and this was the slowest growth rate since May 2021 (Chart 6).
Thanks for reading!
