
There are some signs US consumers are beginning to save up a little and cut down on credit card debt. If – big IF – sustained, this will have consequences for the economy, not to mention stocks.
In general, a drop in money-market fund assets tends to bode well for stocks. Not of late, though.
The four-week moving average of US money-market assets peaked in the week to March 7 at $2.84 trillion. By Wednesday last week, this had dropped to $2.8 trillion (Chart 1). In the aggregate, this money did not find a home in stocks. Between the periods, US-based funds (including ETF’s) lost $10.1 billion (courtesy of Lipper.com).
As well, beginning the week ended March 7 through Monday this week, three S&P 500-focused ETF’s – SPY (SPDR S&P 500 ETF), VOO (Vanguard S&P 500 ETF) and IVV (iShares core S&P 500 ETF) lost a combined $13.8 billion (courtesy of ETF.com). Another $383 million came out of QQQ (PowerShares QQQ ETF), while IWM (iShares Russell 2000 ETF) and IJR (iShares core S&P small-cap ETF) took in $3.1 billion.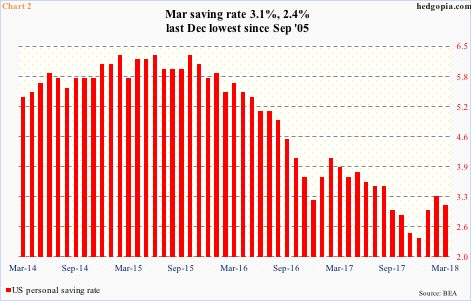
If this is the beginning of a trend, these dynamics will have implications for equities, particularly so as signs are emerging that US households of late are less profligate.
In March, the personal saving rate fell two-tenths of a percentage point month-over-month to 3.1 percent, but has risen from 2.4 percent last December. That was the lowest since 2.3 percent in September 2005. As recently as October 2015, the saving rate was 6.3 percent (Chart 2).
The rise in the saving rate is also coming at an interesting time. The Tax Cuts and Jobs Act of 2017 was signed into law on December 22. It is possible the money from the tax cut is being saved up or used to pay down debt.
Seasonally-adjusted consumer credit in March stood at $3.87 trillion, up from $2.59 trillion when Great Recession ended. Between the periods, student loans went from $712.3 billion to $1.52 trillion and auto loans from $742 billion to $1.12 trillion.
Another category to have just crossed the trillion mark is revolving consumer credit – essentially credit card loans. In March, these loans were $1.03 trillion, versus $963.4 billion in June 2009, which is not that big a jump, but it is off of the low of $831.7 billion in April 2011.
Interestingly for the first time since December 2015, revolving credit fell m/m in February, then again in March (Chart 3). This kind of jives with the recent trend of stocks failing to attract money that is coming out of money-market funds.
Once again, if this persists, this is good news from the viewpoint of households’ financial health, but not so for the US economy, which is increasingly reliant on debt. Already, in January-April, US corporations issued 14 percent less in bond than in the corresponding period last year (more here).
Amidst this, it does not help that crude oil has had some phenomenal rally from February 2016. Ditto with the price of gasoline. Since last December (arrow in Chart 4), the latter has gone up by $0.35.
In 2017, per the EIA, nearly 144 billion gallons of finished motor gasoline were consumed in the US, for a daily average of 391.4 million gallons. Using back-of-the-envelope calculation and simplistically assuming that consumption has not changed, at the recent $2.73/gallon, this equates to $1.07 billion, up from $935 million in December. So consumers are spending $135 million a day more than they were last December. This does not look like much. But in a month, we are talking $4.1 billion, nearly $50 billion a year. No chump change!
It is possible the rise in gasoline price led consumers to make changes to their spending/saving pattern. It is equally possible that they are increasingly growing wary of their stretched balance sheet and have decided to right-size it. The latter will have consequences for the economy, stocks, and what not, hence worth watching.
Thanks for reading!
