Here is a brief review of period-over-period change in short interest in the March 1-15 period in the Nasdaq and NYSE Group as well as nine S&P 500 sectors.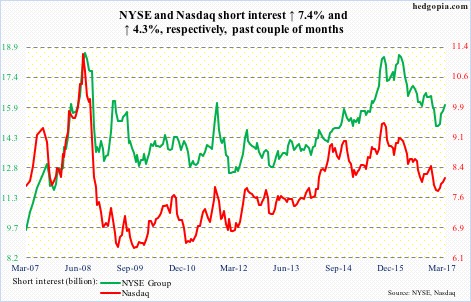
Nasdaq – p/p, short interest ↑ 0.5%, Nasdaq composite ↑ 1.3%
The Nasdaq composite (5828.74) peaked on March 1 at 5911.79, followed by a noticeable 1.8-percent drop on March 21, but bears are still struggling to turn that into downside momentum. The 50-day moving average is yet to be tested.
Should bulls wrestle back momentum, there is a chance a mini-squeeze follows. Short interest has gradually risen in the past couple of months.
NYSE Group – p/p, short interest ↑ 0.9%, NYSE composite ↑ 0.7%
This also holds true with the NYSE composite (11418.89), except the 50-day has already been tested – and intact thus far – with the 10- and 20-day decidedly lower.
There is support at 11100-11200 – a must-save.
…
XLB (SPDR materials ETF) – p/p, short interest ↓ 14.3%, ETF ↑ 0.7%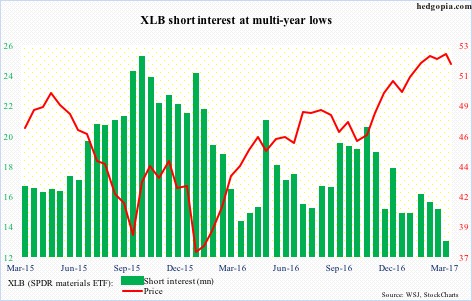
Last Friday, XLB ($51.66) lost the 50-day. Thus far, support at $51-plus has not been lost (tested twice last week). Should it give way, shorts are likely to get aggressive. More so if stronger support at just south of $50 gives way.
XLE (SPDR energy ETF) – p/p, short interest ↑ 6.2%, ETF ↓ 0.8%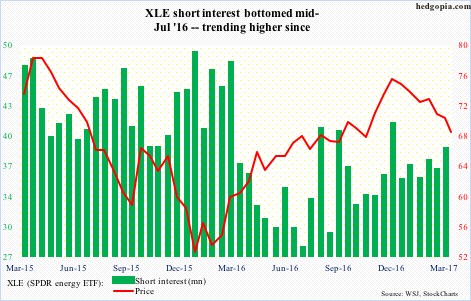
After dropping 12 percent from mid-December last year, XLE ($68.56) has gone sideways the past couple of weeks. Support at $67-$68 is holding. While this is taking place underneath the 200-day, continued sideways action can help – toward damage repair.
XLF (SPDR financial ETF) – p/p, short interest ↑ 1.9%, ETF ↑ 0.8%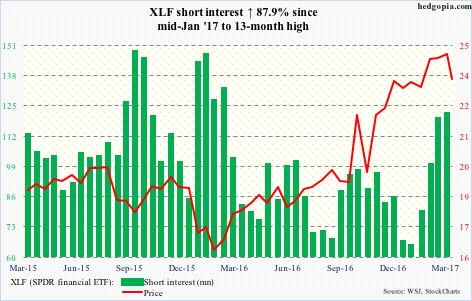
Last week, XLF ($23.54) lost 3.7 percent, slicing through the 50-day and near-term support at $23.70. Shorts have been preparing for this since short interest bottomed mid-Jan.
There is plenty of room for the weekly chart to continue lower. Last November (post-election), XLF had a massive break out of just under $20.
Bulls face a risk of a double top – $25.21 early this month versus $25.31 in May 2007.
XLI (SPDR industrial ETF) – p/p, short interest ↓ 17.1%, ETF ↑ 0.1%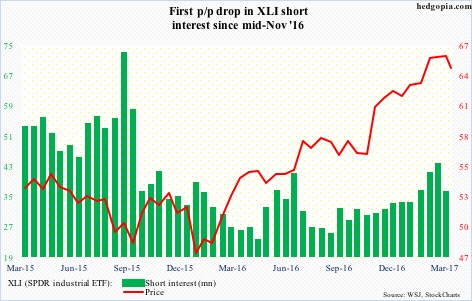
XLI ($64.53) straddled the 50-day in the last three sessions last week. Shorts covered big during the March 1-15 period as if they did not expect a breakdown. This may be true, but medium-term the path of least resistance is down. The weekly chart just developed a bearish MACD cross-under.
XLK (SPDR technology ETF) – p/p, short interest ↓ 2.6%, ETF ↑ 2%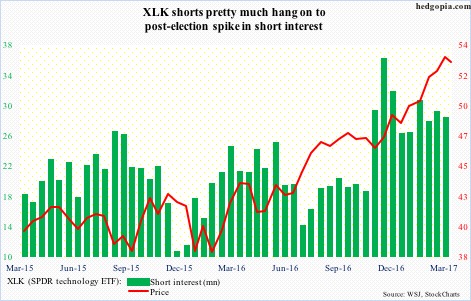
Shorts are acting as if a big drawdown in XLK ($52.84) is coming. Longs so far have denied them of an opening. Last week was a little chink in their armor, with the ETF down for the first time in the last seven weeks.
XLP (SPDR consumer stables ETF) – p/p, short interest ↓ 4%, ETF ↑ 0.4%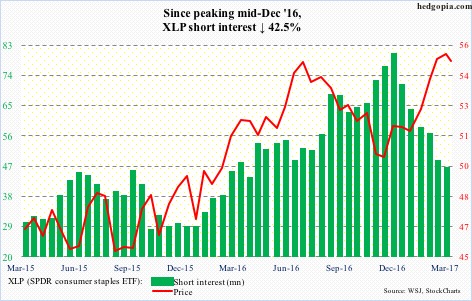
XLP ($54.70) shorts have gotten squeezed big time the past three months. This may be about to change. The $55 level has proven tough to break. Shorter-term moving averages are at least beginning to go sideways. The 50-day is a point away.
XLU (SPDR utilities ETF) – p/p, short interest ↑ 25.9%, ETF ↑ 0.2%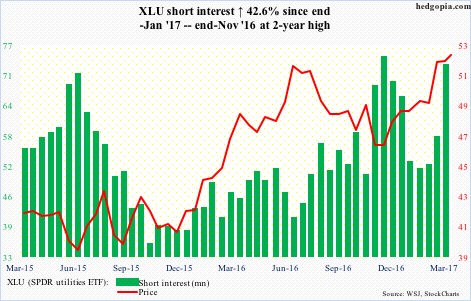
XLU ($51.89) shorts refuse to give up. They are probably hoping for some kind of a double top right around here (July 2016 high of $51.67).
At least near term, the ETF likely weakens, particularly so if 10-year yields (2.4 percent) do not break 2.31 percent and head back toward recent highs of 2.62 percent.
XLV (SPDR healthcare ETF) – p/p, short interest ↓ 4%, ETF ↑ 2.1%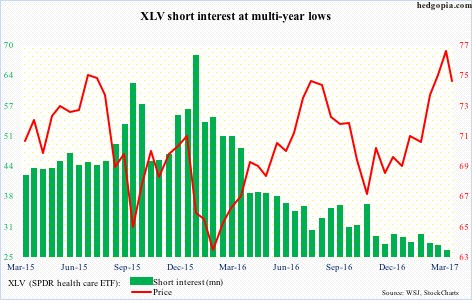
XLV ($74.29) cannot seem to break out of $75-plus (prior highs of July 2015 and August 2016). A failure here can have huge significance. But shorts are not positioned for one – at least not yet.
XLY (SPDR consumer discretionary ETF) – p/p, short interest ↓ 3.8%, ETF ↑ 1.3%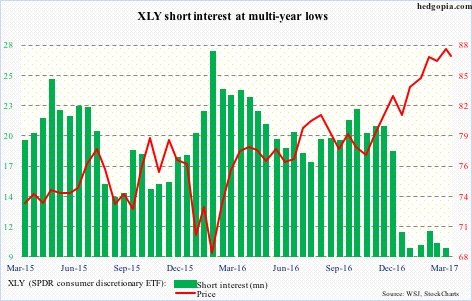
Since they cut back big end-December last year, XLY ($86.56) shorts are not in a mood to get aggressive. So far, that has proven to be a smart strategy. The 50-day was successfully tested last Wednesday.
That said, shorter-term moving averages are going flat to down – something shorts are likely to pounce on if it continues.
Thanks for reading!

