
Here is a brief review of period-over-period change in short interest in the March 31-April 13 period in the Nasdaq and NYSE Group as well as nine S&P 500 sectors.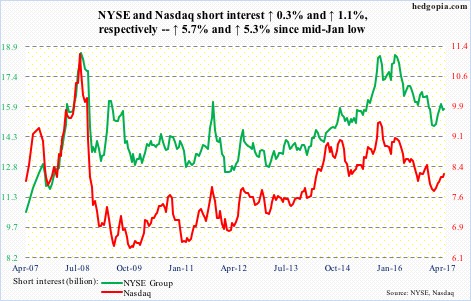
Nasdaq – p/p, short interest ↑ 1.1%, Nasdaq composite ↓ 1.8%
Post-Great Recession, Nasdaq (6025.49) short interest peaked at 9.48 billion at the end of September 2015, then bottomed at 7.77 billion in mid-January this year. From that low through mid-April, it rose 5.3 percent – probably just in time to get squeezed.
This week, the composite broke out of a nearly two-month range to a new high.
NYSE Group – p/p, short interest ↑ 0.3%, NYSE composite ↓ 1.5%
NYSE (11603.27) shorts probably met the same fate.
The composite had been trending lower since hitting a new high of 11687.07 on March 1. This week, it broke out – past both its 50-day moving average and the seven-week-old downtrend line.
Although short interest is well below the 18.5 billion reached in the middle of February last year, from mid-January through end-March this year, it rose 5.7 percent.
…
XLB (SPDR materials ETF) – p/p, short interest ↓ 10.1%, ETF ↓ 2.1%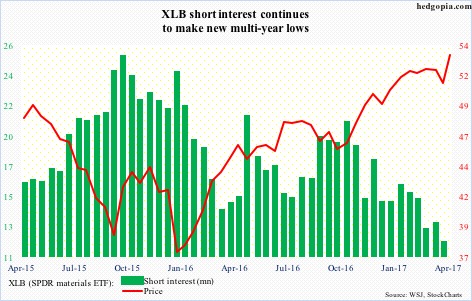
XLB (53.65) broke out of three-month resistance this week – potentially taking out stops and squeezing the shorts.
That said, short interest remains relatively low – hence little odds of a massive squeeze.
XLE (SPDR energy ETF) – p/p, short interest ↓ 3%, ETF ↓ 0.8%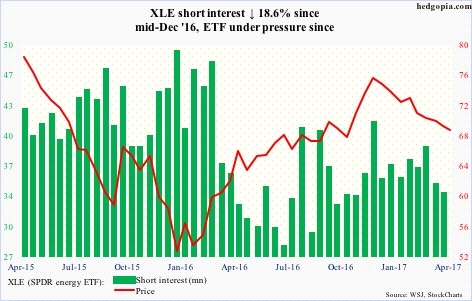
The $67-$68 level on XLE (68.77) has been important for a decade now. Last Friday, it made a low of $67.45 in a doji session – right at its lower Bollinger band.
The ETF lost 13 percent since mid-December last year, and is trying to stabilize. Should a rally ensue, a mini-squeeze can occur.
XLF (SPDR financial ETF) – p/p, short interest ↓ 5.5%, ETF ↓ 3.5%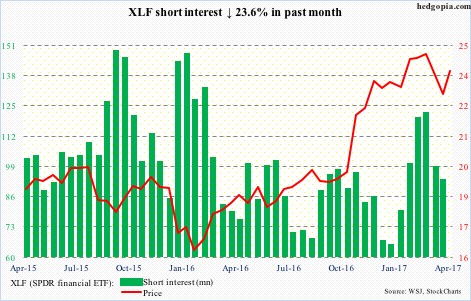
Last week, XLF (23.89) shorts were unable to push the ETF below support at $22.80. Then followed a quick rally this week – in back-to-back doji sessions.
Shorts are likely to get active here. The ETF tagged the 50-day moving average on Tuesday.
XLI (SPDR industrial ETF) – p/p, short interest ↓ 11.7%, ETF ↓ 1.6%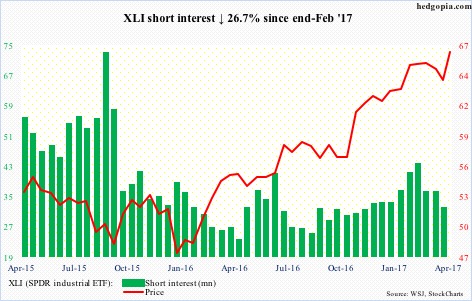
XLI (66.66) shorts have been cutting back since mid-Mar this year. This likely continued. The ETF this week broke past a seven-week-old declining trend line. That said, with three doji sessions in a row, the rally is anything but convincing.
XLK (SPDR technology ETF) – p/p, short interest ↑ 0.7%, ETF ↓ 1.8%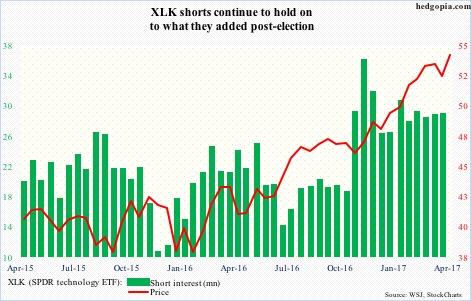
After defending the 50-day moving average the week before, XLK (54.08) bulls forced a breakout this week – to a new high. Shorts likely took it on the chin. They have added post-U.S. presidential election last November.
XLP (SPDR consumer stables ETF) – p/p, short interest ↓ 5.8%, ETF ↑ 0.5%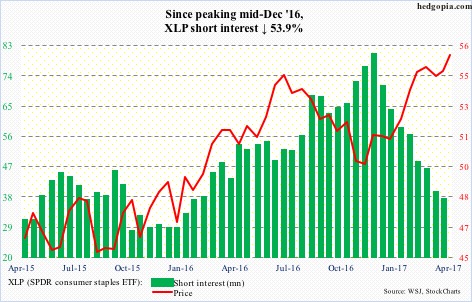
XLP (55.72) short interest peaked mid-December last year, before coming under sustained pressure. Shorts deserve kudos to have gotten out of the way. The ETF has rallied relentlessly since early December.
XLU (SPDR utilities ETF) – p/p, short interest ↑ 8.3%, ETF ↑ 0.7%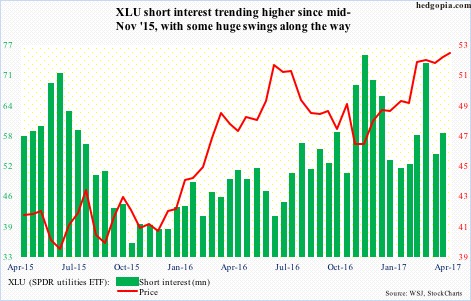
The bull-bear duel on XLU (51.93) continues at $52. Should a breakout occur, squeeze fuel is decent.
XLV (SPDR healthcare ETF) – p/p, short interest ↓ 6.9%, ETF ↓ 0.5%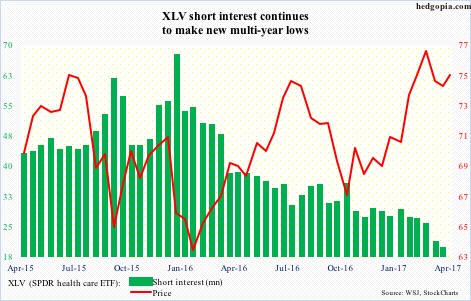
XLV (74.73) shorts continue to take it easy even though the mid-March breakout – past prior highs of July 2015 and August 2016 – has so far proved fleeting. Short interest, which has persistently declined for over a year, was probably not much help.
XLY (SPDR consumer discretionary ETF) – p/p, short interest ↑ 3.9%, ETF ↓ 1.6%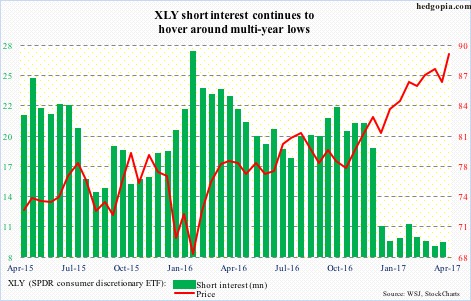
XLY (89.52) shorts massively cut back During the end-December period. This is proving to be a smart decision. The ETF made yet another high this week, although squeeze fuel was non-existent.
Thanks for reading!
