Here is a brief review of period-over-period change in short interest in the May 16-31 period in the Nasdaq and NYSE Group as well as nine S&P 500 sectors.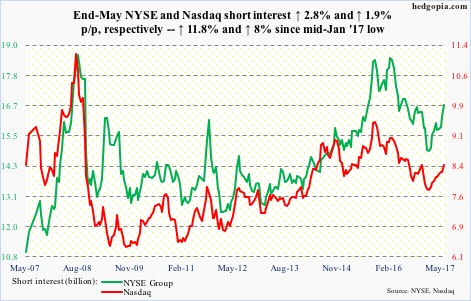
Nasdaq
The uptrend in short interest since the mid-January low this year continues. Shorts probably feel vindicated by what transpired last Friday. The composite fell 1.8 percent, with an outside day/week.
Nearest support lies at the 50-day moving average (6057.1) – 2.4 percent away.
NYSE Group
NYSE shorts, on the other hand, probably got squeezed last week. The composite early this month witnessed another breakout – past 11600-plus. Through end-May, short interest had risen 11.8 percent from the mid-January low.
Also in January, it had a major break out of 11100-11200, followed by three months of sideways action at 11600-11700.
…
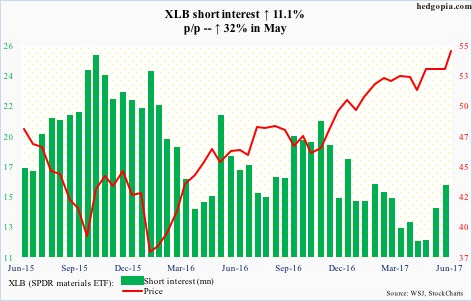
End-May short interest rose to a four-month high, but likely just in time to get squeezed. On June 1, XLB (54.63) broke out of four-month range resistance at 53, and built on it further last Friday.
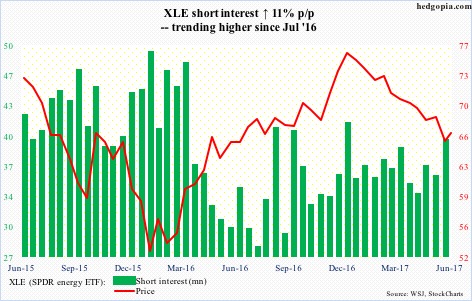
As oversold as XLE is, bulls have been unable to sustainably rally. Last Friday produced nice price action. Should a follow-through occur, short interest is decent enough to provide a tailwind, particularly so if the ETF (66.42) takes out the 50-day (67.92).
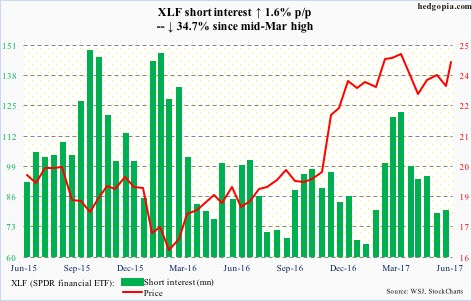
Shorts have cut back from mid-March this year, yet likely played a role in the 3.6-percent rally in XLF last week.
The ETF, caught in a one-point range since last December with a false breakout in February, broke out of resistance at 23.70. There is room to rally on the weekly chart.
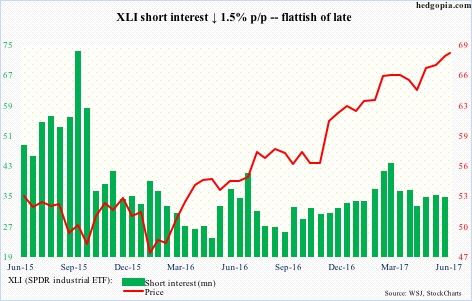
Nearly three-month resistance at 67 fell during the reporting period.
XLI (67.91) short interest has been building since September last year, but nothing too aggressive. There is not much squeeze potential.
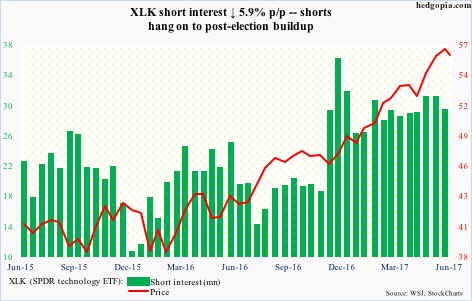
Kudos to shorts for their stubborn bearishness. After post-election buildup, they have steadfastly stayed with rather-elevated short interest. Last Friday, XLK (56.02) dropped 2.5 percent, with an ominous-looking candle.
The path of least resistance is the 50-day (54.78), where shorts can be tempted to cover.
XLP (SPDR consumer stables ETF)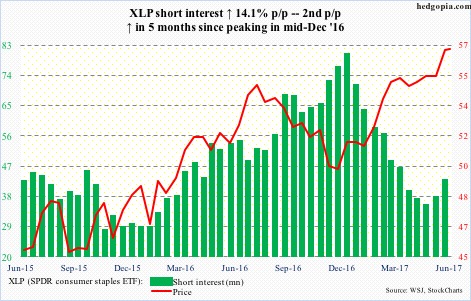
After coming under persistent pressure for four months, XLP short interest went up 22 percent in May. During the reporting period, shorts added even as the ETF (56.67) rallied 2.7 percent.
At least near term, XLP is itching to go lower. There is support at 55-plus.
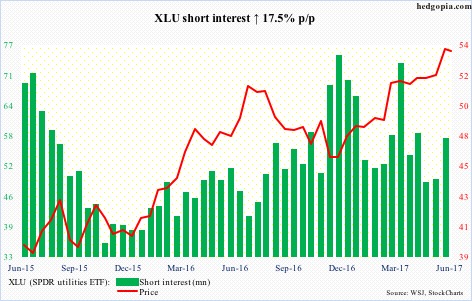
XLU’s (53.67) chart looks similar to XLP’s. Also here, shorts added during the reporting period, with signs the ETF wants to go lower. There is support at 52, which also approximates the 50-day.
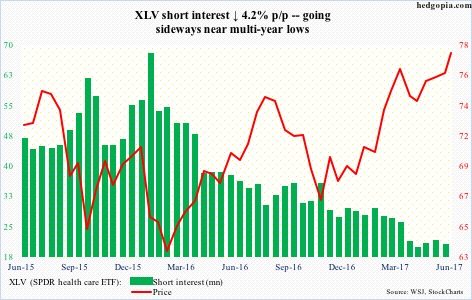
XLV short interest peaked in January last year. The ETF (77.52) rallied to a new high last Friday. Shorts – wisely – have decided to stay on the sidelines. Their odds grow only if the ETF pushes below 75-76.
XLY (SPDR consumer discretionary ETF)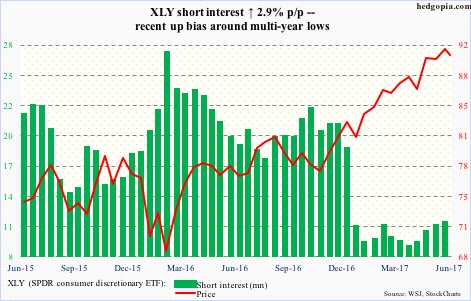
Short interest has gone up the past couple of months but from a subdued level. Having been burned earlier, they are playing cautious.
That said, the ETF (90.37) just flashed a bearish weekly engulfing candle. Shorts probably get aggressive if the 50-day (89.37) is lost.
Thanks for reading! Please share.

