
Here is a brief review of period-over-period change in short interest in the June 1-15 period in the Nasdaq and NYSE Group as well as nine S&P 500 sectors.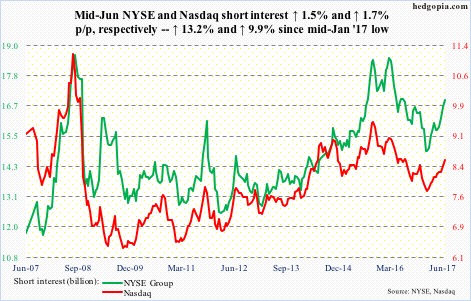
Nasdaq
On June 9, the composite rose to an all-time high 6341.7, only to reverse and close down 1.8 percent. In the subsequent sessions, however, bears failed to push it under the 50-day moving average.
Short interest has continued to accumulate the past five months. Shorts likely get squeezed if the all-time high gets taken out. That said, signs of fatigue are showing up. The intraday reversal yesterday sets up a lower high.
NYSE Group
On June 1, the composite broke out of 11600-plus, followed by a rally to 11836.96 on June 19. Just a few days after the breakout, a retest took place, and it was successful. Another retest likely is in the making.
…
XLB (SPDR materials ETF)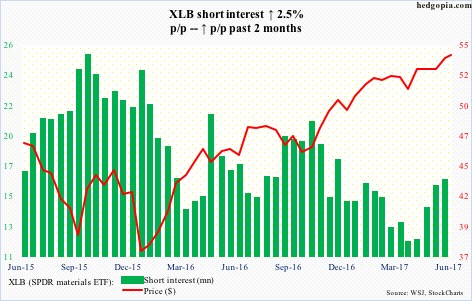
On June 1, XLB (54.01) broke out of four-month range resistance at 53, then proceeding to rally to a new all-time high 54.96 on June 14. Since that high, the ETF has come under pressure. A breakout retest, which also approximates the 50-day, seems likely.
XLE (SPDR energy ETF)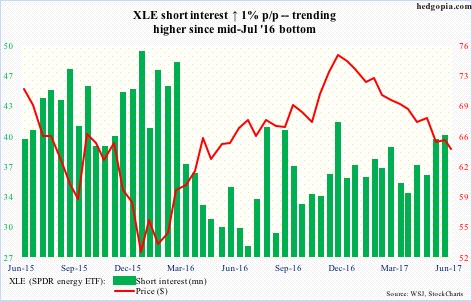
XLE (64.24) is still trapped in a falling channel from last December. The trend line gets broken near 66.50, which is where the 50-day rests. Until then, bears have the ball, and they have been adding.
XLF (SPDR financial ETF)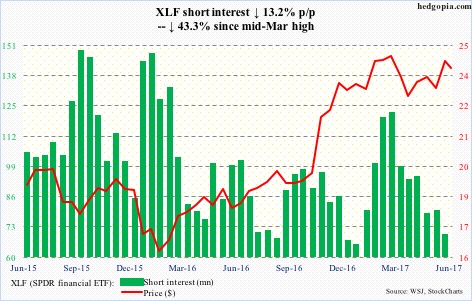
Last week produced a bearish engulfing candle, coming on the heels of a weekly doji.
The ETF (24.02) has been under pressure since hitting 24.59 on June 19. It broke out of range resistance at 23.70. A retest looks imminent. The 50-day (23.65) lies right there.
XLI (SPDR industrial ETF)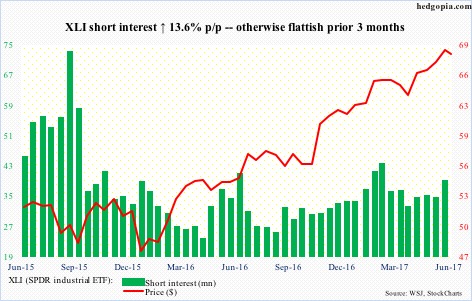
On May 25, XLI (68.03) broke out of nearly three-month resistance at 66.75, followed by a successful retest on June 7, then a new high 69.19 on June 19. That breakout now approximates the 50-day (66.71), and should act like a magnet near term.
XLK (SPDR technology ETF)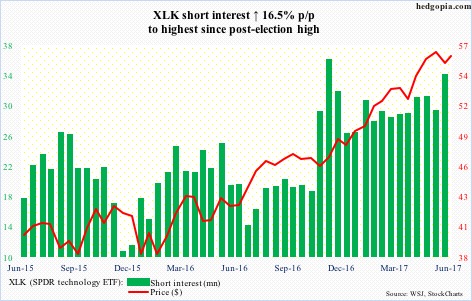
Having come on the heels of seven straight up months, June so far has produced a spinning top. A little fatigue is setting in.
The ETF (56) collapsed 2.5-percent on June 9, and it looked like shorts were right to stubbornly stay short. That said, bulls were able to defend the 50-day, but would need a new high to negate the bearish engulfing candle on the 9th.
XLP (SPDR consumer stables ETF)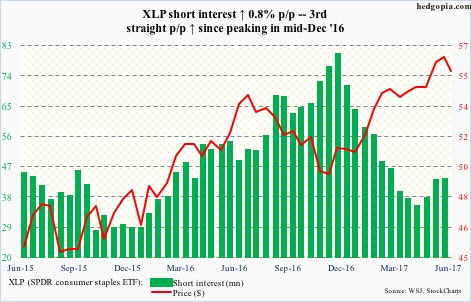
After rallying to a new high 56.92 on June 5, XLP (55.71) came under pressure.
The daily chart enters oversold territory even as the ETF is testing the 50-day, which also approximates near-term support at 55-plus.
XLU (SPDR utilities ETF)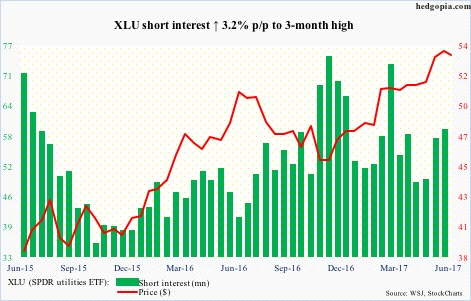
XLU (53.57) has found resistance at/near 54.20 the past four weeks, even as the 10- and 20-day are converging. A bearish cross-under likely opens the door for a test of the 50-day (52.32). Just underneath lies another support at 51.75.
XLV (SPDR healthcare ETF)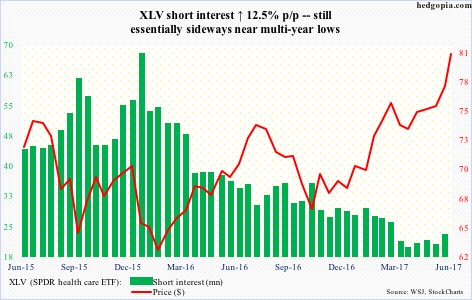
XLV (80.39) has gone parabolic June-to-date, up 6.1 percent. This followed a break in May out of nearly two-year resistance at 75. Shorts played no role in the latest move, as they pretty much stayed on the sidelines.
XLY (SPDR consumer discretionary ETF)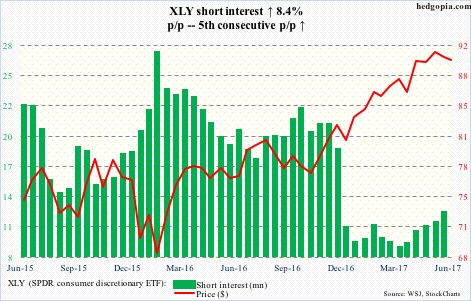
Three weeks ago, XLY (89.84) rose to a new high 92.14, but the week also produced a bearish engulfing candle. The drop since pushed it under the 50-day, which was meekly recaptured yesterday.
Should a rally ensue, there is very little squeeze fuel.
Thanks for reading! Please share.
