
Here is a brief review of change in short interest in the September 15-30 period in the Nasdaq and NYSE Group as well as nine S&P 500 sectors.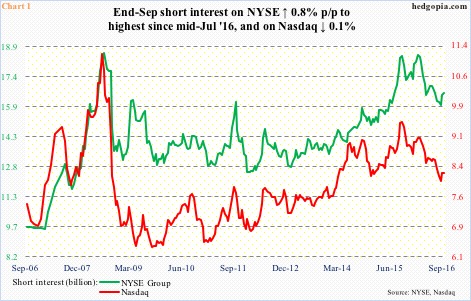
Nasdaq – short interest down 0.1 percent p/p; Nasdaq composite up 1.2 percent
During the period, the Nasdaq rose to yet another all-time high of 5342.88 on September 22, but shorts stayed put. In fact, in the past month, short interest rose 2.4 percent. Hindsight is always 20/20, but shorts have gotten it right. This Tuesday, the Nasdaq dropped 1.5 percent to lose near-term support at 5270.
NYSE Group – short interest up 0.8 percent p/p; NYSE composite up 1.1 percent
Short interest has gone up four percent in the past month. Shorts may be onto something.
During the Sep 15-30 period, only once did the NYSE closed above the 50-day moving average, which is now slightly declining. Technically, September was a spinning top, and August a doji. Plus, September’s high of 10903.86 is below the May 2015 all-time high of 11254.87. In this respect, of the major U.S. indices, the NYSE acts like the Russell 2000 small cap index, which is still below the all-time high of June last year. The S&P 500 index, Dow Industrials and the Nasdaq have rallied to new all-time highs.
Speaking of the S&P 500, short interest on SPY, the SPDR S&P 500 ETF, dropped 16.6 percent during the period. The ETF was only up one percent. Did shorts cover because they feared an earnings-driven rally? Whatever the case, support at 2120 on the S&P 500 needs to give way before shorts can press their case.
Of the nine S&P 500 sectors below, short interest dropped in seven p/p.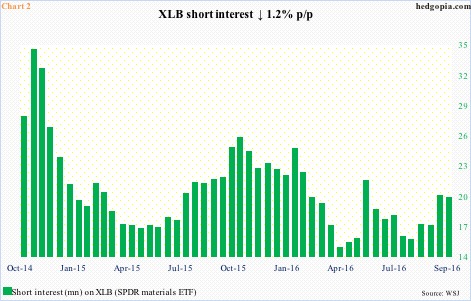
XLB (SPDR materials ETF) – short interest down 1.2 percent p/p, ETF up 1.7 percent
Since the September 9th breach of its 50-day moving average, XLB has traded below that average, which is now declining. Monthly momentum indicators seem to want to go lower. The ETF represents one of the cyclically oriented sectors.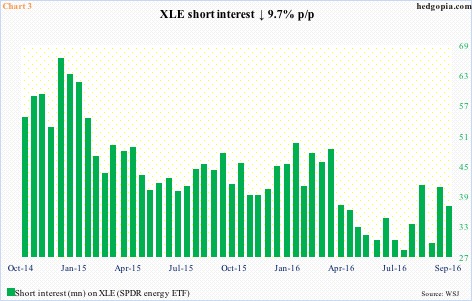
XLE (SPDR energy ETF) – short interest down 9.7 percent p/p, ETF up 3.8 percent
XLE is another one of those cyclically oriented sectors. The sector currently is a victim of both rising supply and waning demand as the global economy softens. The September 30th high of $70.98 approximates resistance going back to March 2011, which is what probably led shorts to cover.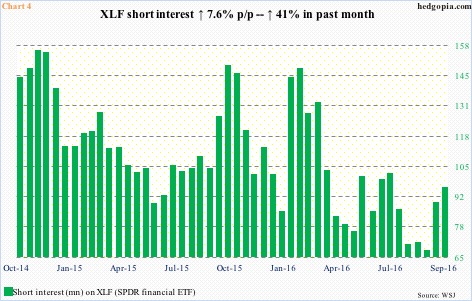
XLF (SPDR financial ETF) – short interest up 7.6 percent p/p, ETF down 0.2 percent
XLF, an underperformer this year, traded sub-$19 twice in late September before responding to rising rates. Amidst hawkish comments from some FOMC members, the two-year Treasury yield surged from 0.73 percent on September 29 to 0.77 a day later (closed this Tuesday at 0.87 percent).
In the meantime, short interest has gone up 41 percent in the past month. This Friday, JP Morgan (JPM), Wells Fargo (WFC), PNC Financial (PNC), and Citibank (C) report.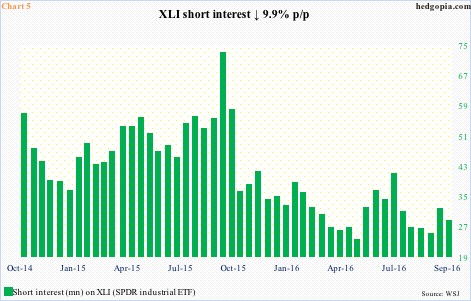
XLI (SPDR industrial ETF) – short interest down 9.9 percent p/p, ETF up 2.3 percent
XLI, representing a cyclical sector, rallied back above the 50-day moving average. Shorts either covered or got squeezed. The rally did not last, however, with the ETF losing the average in the current period. September produced what looks like a cross between a long-legged doji and a hanging man. That said, it is still above $56 support. A break below would embolden shorts.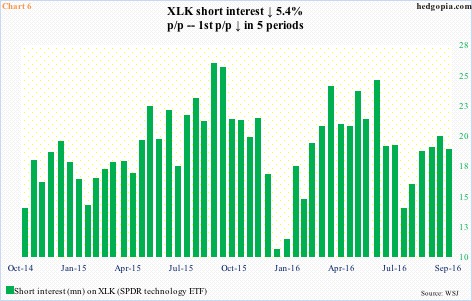
XLK (SPDR technology ETF) – short interest down 5.4 percent p/p, ETF up 0.8 percent
XLK rose to $47.97 on September 22 in a doji session. September was the highest monthly close since March 2000. In the current period, on October 10, it rose to an all-time high of $48.06, before dropping 1.1 percent in the next session, but is still above the 50-day moving average. Short interest has gone up since mid-July, probably betting that a break would occur in due course.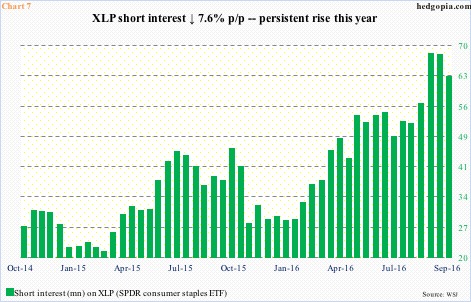
XLP (SPDR consumer stables ETF) – short interest down 7.6 percent p/p, ETF up 0.5 percent
XLP tried to rally but was rejected at $53.50 resistance. It peaked at $55.68 on July 14. That September 22nd failure, however, failed to embolden shorts. Short interest is already massive. The remaining shorts have been vindicated, as in the current period the ETF lost the 200-day moving average.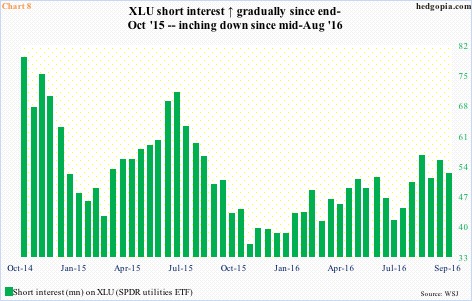
XLU (SPDR utilities ETF) – short interest down 5.4 percent p/p, ETF up 0.4 percent
XLU was up five percent to $51.23 through September 27, and then bond proxies got hit, thanks to the surge in interest rates as noted above, with the ETF losing 4.4 percent in the next four sessions from that high. The 50-day moving average was first recaptured and then lost. The January 2015 high of $46.85 is crucial; if it is lost, shorts will get emboldened. Short interest has been inching higher.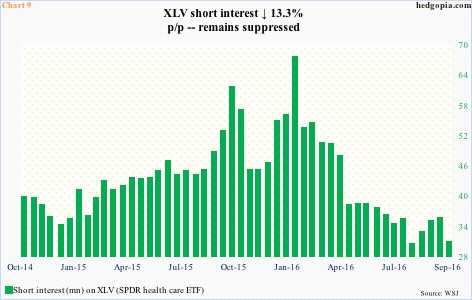
XLV (SPDR healthcare ETF) – short interest down 13.3 percent p/p, ETF up 0.7 percent
Through September 22, XLV was up two percent for the period to $73.47 – probably explains the drop in short interest during the period. That high was repelled at the 50-day moving average. September was a spinning top. Shorts are getting traction, even though short interest remains suppressed. Short-squeeze fuel is no longer as potent as was early this year.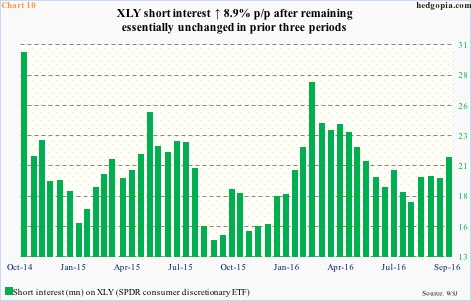
XLY (SPDR consumer discretionary ETF) – short interest up 8.9 percent p/p, ETF up 1.7 percent
Shorts were probably not convinced of XLY’s rally during the period. The ETF stayed under the 50-day moving average throughout the period. September was a hanging man candle. In the current period, support-turned-resistance at $80 held.
Thanks for reading!
