
Here is a brief review of period-over-period change in short interest in the June 16-30 period in the Nasdaq and NYSE Group as well as nine S&P 500 sectors.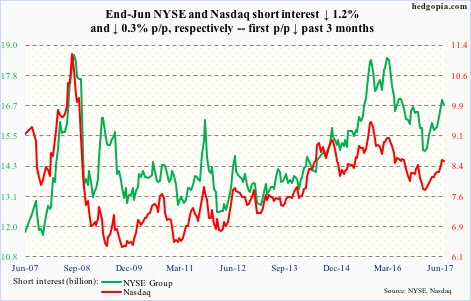
Nasdaq
The 50-day moving average was slightly breached, but support at 6100 held. The bounce since has reclaimed the average.
The composite (6261.17) peaked at 6341.7 on June 9. A trend line drawn from that high was tested Wednesday, with the composite closing right underneath. Should a breakout occur – likely – there is plenty of fuel for short squeeze.
NYSE Group
Support at 11600-11700 was tested twice during the reporting period. Another test occurred this Tuesday. All successful.
The composite rallied 0.7 percent Wednesday to test its all-time closing high, and has essentially gone sideways for five weeks. Should the bulls manage to press further, shorts can get squeezed.
…
XLB (SPDR materials ETF)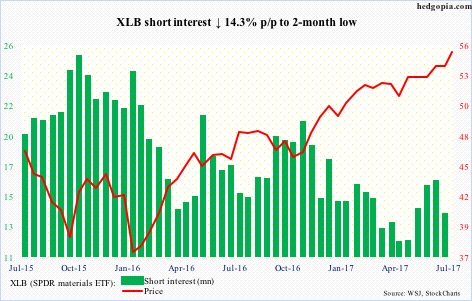
On June 1, XLB (55.03) broke out of four-month range resistance at 53. Since then, the bulls have been stepping up in defense of support, including this Tuesday when 10- and 20-day were defended. Wednesday, it rallied to a new high.
Shorts in the meantime are taking it easy.
XLE (SPDR energy ETF)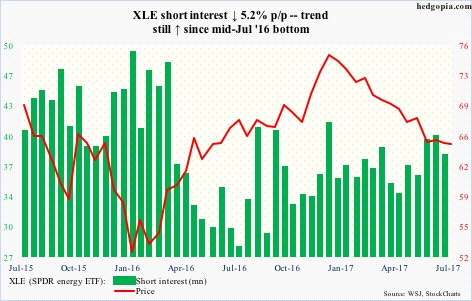
XLE (64.75) continues to trade within a downtrend channel from last December. The trend line gets broken near 65.50. A little above lies the 50-day (65.77). A breakout will be massive. Short interest is decent enough to potentially cause a squeeze. Until then, it is the bears’ ball to lose.
XLF (SPDR financial ETF)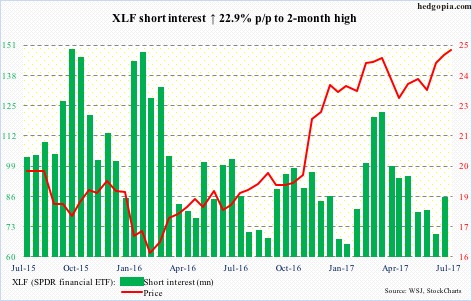
XLF (24.88) bulls once again went after resistance just north of 25, which was first hit in May 2007, followed by an unsuccessful breakout bid this March. The bulls have had another go at it on July 3, but were once again repelled. Shorts – likely encouraged – added during the period.
XLI (SPDR industrial ETF)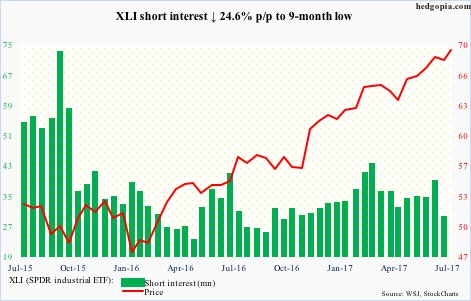
The 50-day (67.36) was just about tested on June 29. The rally since saw XLI (69.18) rise to a new all-time high of 69.50 on Wednesday, but the session closed poorly with a gravestone doji, which suggests a trend change may be at hand. Needs confirmation, though.
XLK (SPDR technology ETF)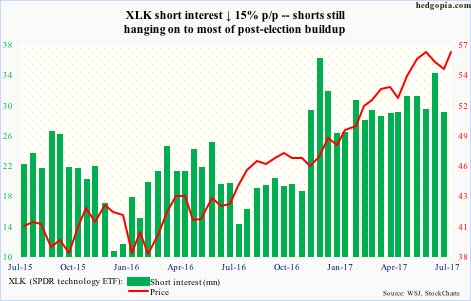
Since June 9 when XLK (56.25) rose to a new all-time high of 57.39, it had been trading within a channel. The ETF broke out of it Wednesday, albeit barely. Should the bulls build on it, there is potential for short squeeze. Shorts got aggressive post-November ’16 election, and are hanging on to most of it.
XLP (SPDR consumer stables ETF)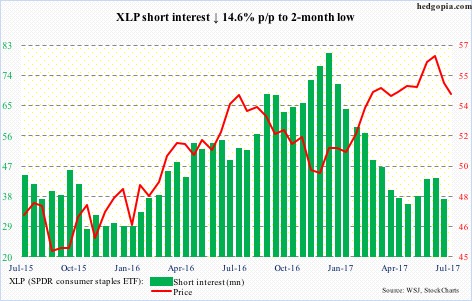
After rallying to a new all-time high of 56.92 on June 5, XLP (54.28) has been under persistent pressure, losing the 50-day and trading along a sharply falling lower Bollinger band until Wednesday.
Support at 54, which goes back to June 2016, was tested Tuesday – likely holds near term.
XLU (SPDR utilities ETF)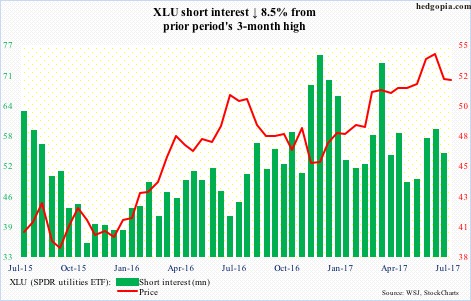
On June 16, XLU (51.86) rallied to a new all-time high of 54.22, unsuccessfully testing a prior high of 10 sessions ago. The drop since saw the ETF drop to the 50.70-51.70 range.
The daily chart is oversold – and is itching to move up.
XLV (SPDR healthcare ETF)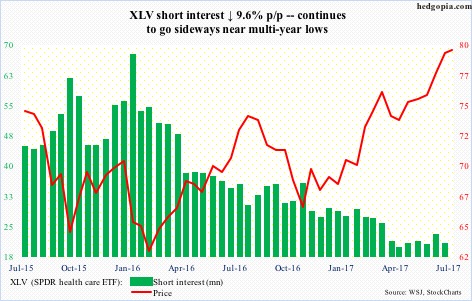
XLV (79.52) had a major break out of nearly two-year resistance at 75 in May. After a subsequent rally to 81.08 on June 22, it came under slight pressure, with room to go lower if weekly overbought conditions begin to unwind. Shorts likely would not get aggressive until the ETF loses 75.
XLY (SPDR consumer discretionary ETF)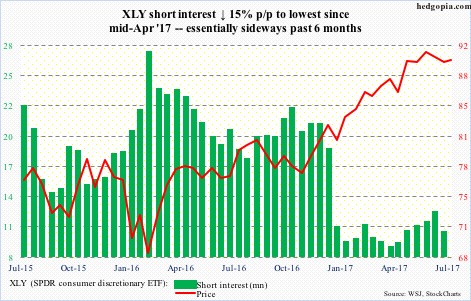
Since XLY (89.89) rose to a new high 92.14 on June 5, it had been all downhill until July 6 when the bulls defended support at 88.40. Wednesday, the ETF rallied to close right at the 50-day.
Shorts – wisely – have essentially stepped aside the past six months.
Thanks for reading! Please share.
