Here is a brief review of period-over-period change in short interest in the July 1-14 period in the Nasdaq and NYSE Group as well as nine S&P 500 sectors.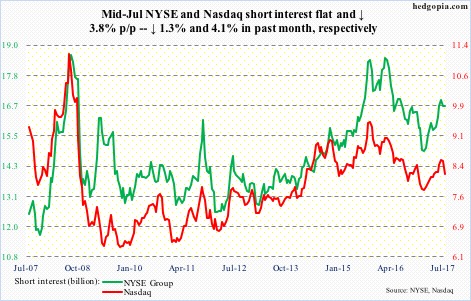
Nasdaq
The bearish engulfing candle of June 9 when the composite (6412.17) lost 1.8 percent is a distant memory. That high (6341.7) has now been surpassed, although this took place in the current period.
Shorter-term moving averages are rising, and the 50-day, which was lost briefly, has been recaptured. Shorts probably lent a helping hand. They cut back a tad in the past month, but short interest remains elevated.
NYSE Group
Support at 11600-11700 on the composite (11965.72) was tested again during the reporting period. This was preceded by two successful tests in the prior period. Defense of this support and a subsequent rally has resulted in another near-term support at 11850-ish.
Shorts continue not to trust the rally.
…
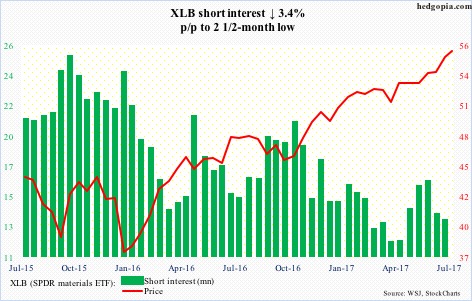
After a brief bearish cross-under between 10- and 20-day toward the end of June, XLB (55.80) quickly got back on track. After successful defense several times this month of 55, it rose to a new high Tuesday.
Shorts are not getting aggressive.
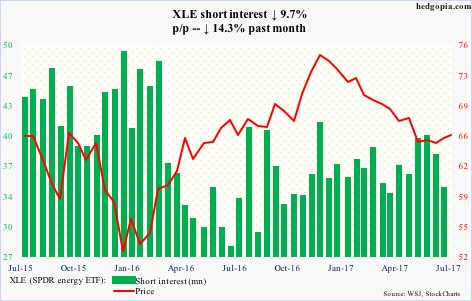
XLE (65.81) on July 19 broke out of a downtrend channel from last December, but building on it has proven difficult.
That said, the bulls defended the 20-day on Monday, followed by recapturing of the 50-day on Tuesday. Shorts have been cutting back. The ETF is up 1.4 percent month-to-date, preceded by six straight months of decline.
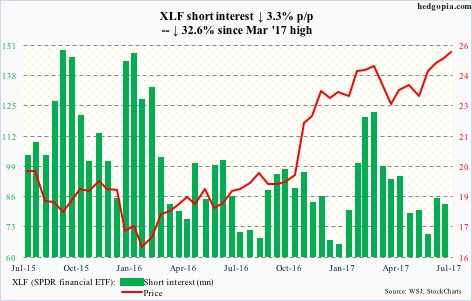
On July 3, XLF (25.22) once again went after resistance just north of 25 – first hit in May 2007 and then March this year – and was repelled. The subsequent drop persistently found support at the 20-day, which laid the foundation for another crack at that resistance this Tuesday.
A genuine breakout can self-fulfill as shorts get squeezed.
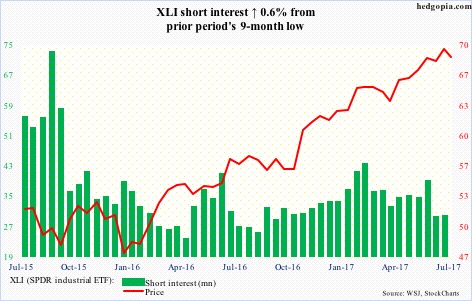
XLI (68.54) has been under pressure since it rose to a new high of 69.58 on July 14, losing both 10- and 20-day in the process. The 50-day (67.85) is right underneath.
There is decent support at 66.50.
Shorts are pretty much in wait-and-watch mode.
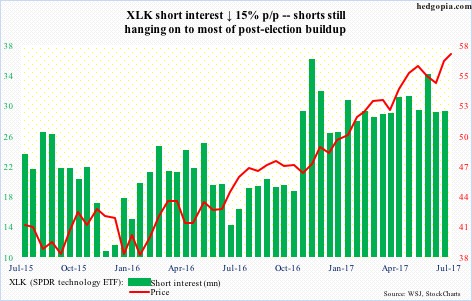
After seven straight up months, XLK (57.50) fell in June. Shorts are staying put with their elevated holdings. The ETF this Monday rose to a new high of 57.66.
For the past five sessions, the bulls have defended near-term support just north of 57. The 10-day – rising – is right underneath. Daily momentum is waning, though.
XLP (SPDR consumer stables ETF)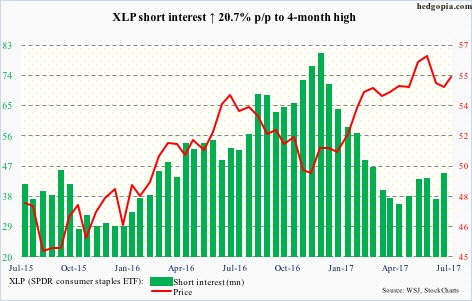
XLP (55.28) came under significant pressure between June 5 when it rallied to a new all-time high of 56.92 and July 11 when it bottomed at 53.86. Support at 54 goes back to June 2016, and has been saved.
The 50-day (55.44) – another hurdle – lies above.
Short interest has trended higher in the past two and a half months.
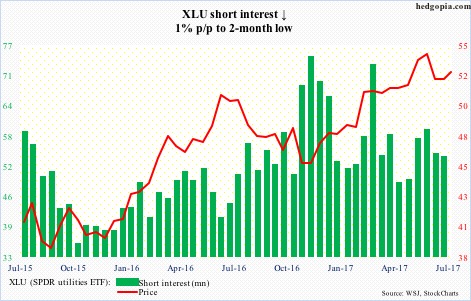
Since peaking on June 16 at 54.22, XLU (52.49) came under sustained pressure, until the bulls defended support at 50.70-51.70.
The rally since the July 11 bottom saw sellers come out this week near the upper daily Bollinger band and the 50-day – likely good news for shorts near term.
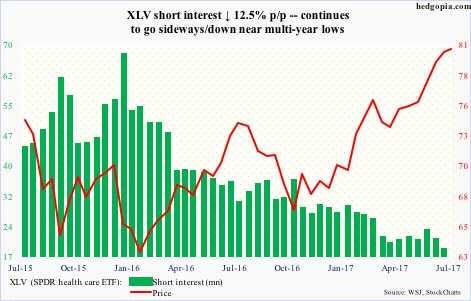
XLV (80.38) had a major break out of nearly two-year resistance at 75 in May. By June 22, it had rallied to 81.08. This level resisted rally attempts in the past four sessions.
The daily chart is itching to go lower, with the 50-day at 78.05.
Shorts continue to remain on the sidelines.
XLY (SPDR consumer discretionary ETF)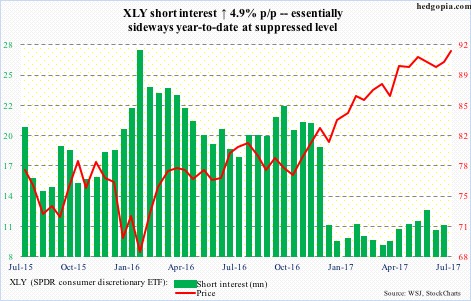
XLY (91.46) has mounted a serious rally since bottoming on July 6 at 88.35 – past the 50-day as well as shorter-term averages.
The all-time high of 92.14 of June 5 stands. Shorts are acting as if they expect a breakout.
Thanks for reading! Please share.

