
Here is a brief review of period-over-period change in short interest in the October 16-31 period in nine S&P 500 sectors.
XLB (SPDR materials ETF)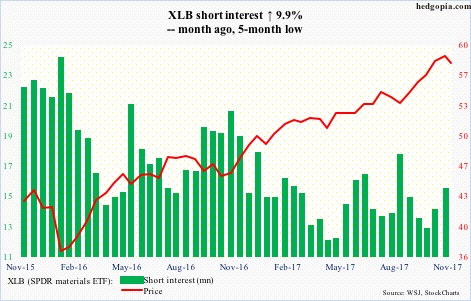
XLB (58.20) peaked at 59.62 on the 26th. There are signs of distribution of late. Shorter-term moving averages are rolling over.
There is plenty of room for downward pressure on the weekly chart. Short-term support lies at 58.
Shorts got active a tad in October.
XLE (SPDR energy ETF)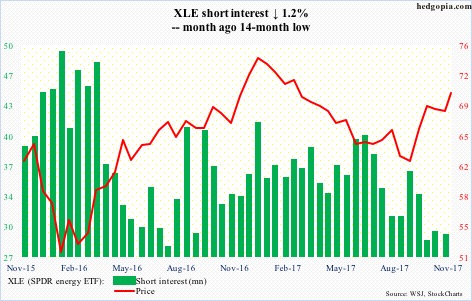
Between December 12 last year and August 21 this year, XLE (70.03) dropped from 76.04 to 61. A 61.8-percent Fibonacci retracement of that decline comes to 70.29. This Tuesday, the ETF peaked at 70.47. This is important resistance. XLE is overbought on the daily chart.
Nearest support lies at 68.90, and after that the 50- and 200-day (67.24 and 66.61, respectively).
XLF (SPDR financial ETF)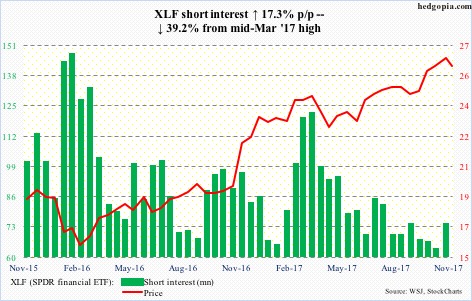
XLF (26.16) has been slightly under pressure since peaking six sessions ago at 26.93, and has room to continue to head lower. Short-term resistance lies at 26.40.
That said, it is comfortably above 25, where resistance-turned-support goes back more than a decade and which it broke out of in September after several tries.
XLI (SPDR industrial ETF)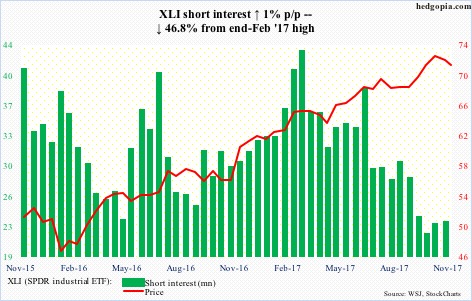
XLI (70.96) is beginning to show signs of fatigue. In a shooting star session, it peaked on the 24th at 73.20. The bulls have lost both the 10- and 20-day, literally closing on the 50-day Thursday.
XLK (SPDR technology ETF)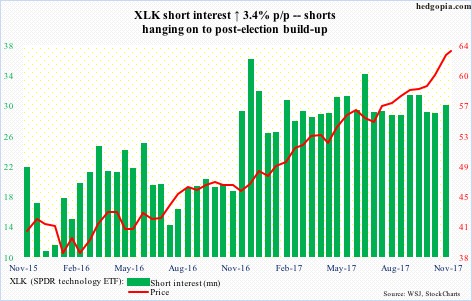
Since defending the 20-day on the 25th through Wednesday’s all-time high, XLK (63.50) jumped six-plus percent. In 11 sessions!
Some cracks are beginning to appear in the prevailing momentum.
Shorts continue to hang on to post-election buildup in short interest.
Nearest support lies at just north of 61.
XLP (SPDR consumer stables ETF)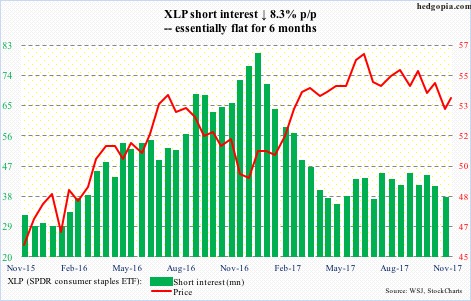
No sooner did XLP (53.73) lose 53.60 than the one-plus-year support was recaptured – but barely. The ETF bottomed at 52.43 this Tuesday, rallying off of the daily lower Bollinger band.
The bulls face tons of resistance above – 50-day at 54.13, 200-day at 54.32 and a declining trend line from June this year at 54.50.
XLU (SPDR utilities ETF)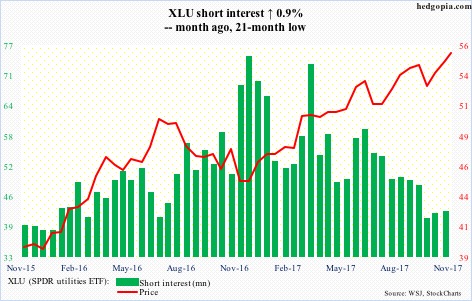
Support at 53.80 was just about tested on the 25th – successfully. The rally since saw XLU (55.77) past two-and-a-half-month resistance at 55. Recent peak in rates helped, with 10-year yields peaking on the 25th as well.
The bulls have the ball as long as 55 holds.
XLV (SPDR healthcare ETF)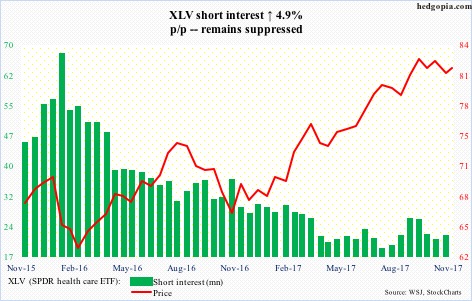
Since peaking at 84.31 on the 23rd, XLV (81.73) came under pressure, but kudos to the bulls for defending support at 81, which goes back to June this year. The 50-day has been lost nonetheless. There is room to rally on the daily chart, provided the bulls are able to conquer that average.
XLY (SPDR consumer discretionary ETF)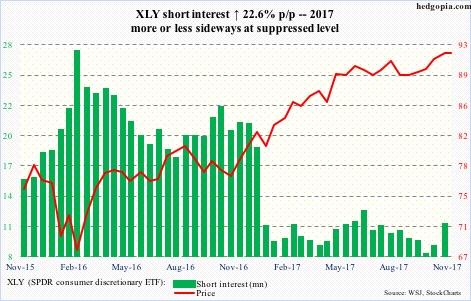
XLY (92.06) keeps getting repelled at $92, which has resisted rally attempts since June this year, but the bulls are not giving up.
Short interest has pretty much gone sideways at a subdued level throughout this year – not leaving much room for squeeze.
A convincing breakout hence will be significant. Down below, there is support from a rising trend line from February last year around 90.50.
Thanks for reading!
