
Here is a brief review of period-over-period change in short interest in the January 16-31 period in nine S&P 500 sectors.
XLB (SPDR materials ETF)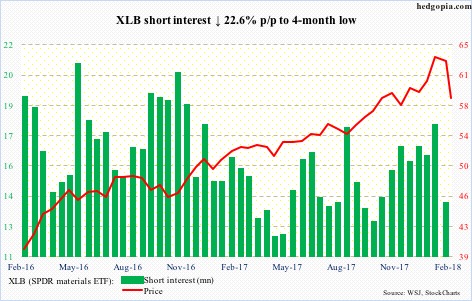
XLB (58.42) shorts gave up as the ETF continued higher, rising to a new all-time high of 64.17 by the 26th. Then the bottom fell out. The subsequent collapse had it slice through the 50-day moving average and then test the 200-day last Friday.
The path of least resistance is up as long as last week’s low (56.62) is not breached.
XLE (SPDR energy ETF)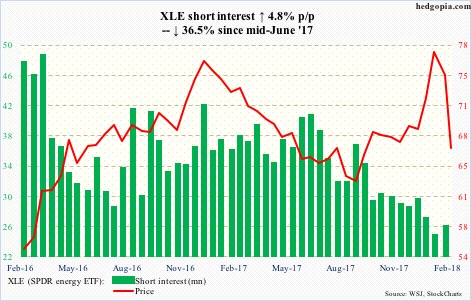
XLE (66.67) peaked at 78.39 on January 24th, one day before spot West Texas Intermediate crude did. Then began the cliff dive, losing both the 50- and 200-day.
By last Friday, XLE posted an intraday low of 64.45, with the session producing a potentially bullish hammer reversal. Importantly, a rising trend line (around 65.50) from the lows of January 2016 was tested, and saved.
XLF (SPDR financial ETF)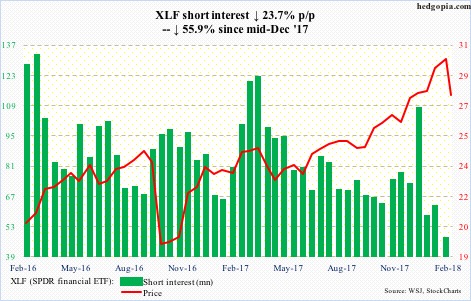
XLF (27.68) short interest is down 55.9 percent since mid-December last year. Shorts got squeezed big time, as the ETF went on to rally to 30.33 by the 29th. In the next nine sessions, it lost the 50-day and tested short-term support at 26.90. The test was successful.
On the daily chart, there is room for XLF to move higher. Resistance at the 50-day lies at 28.51.
XLI (SPDR industrial ETF)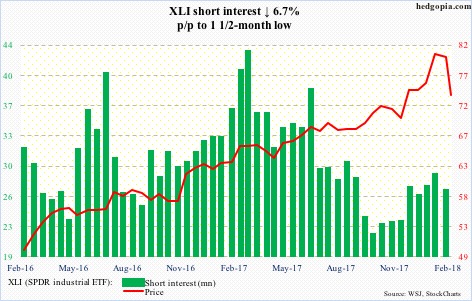
After peaking at 80.96 on the 29th and proceeding to lose the 50-day in the subsequent selloff, XLI (73.81) just about tested the 200-day last Friday – intraday low of 71.49 versus the average at 71.02. Buyers swooped in near that support. The path of least resistance is the 50-day at 76.67.
XLK (SPDR technology ETF)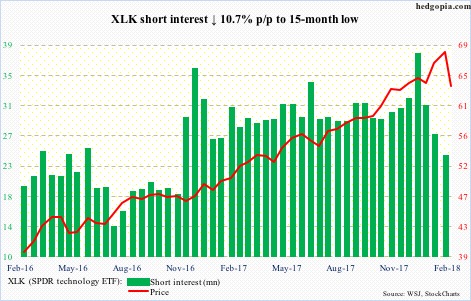
XLK (63.53) short interest has gone down 37.4 percent in the past couple of months to a 15-month low. Shorts have gotten squeezed. But the stubborn/brave ones were rewarded in the current period as the ETF came undone. Sort of.
Post-last Friday’s reversal, odds favor it stabilizes/rallies near term.
XLP (SPDR consumer stables ETF)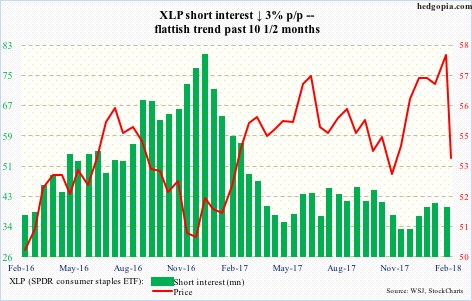
Late November last year, XLP (53.71) had an important break out of 56, then rallying all the way to 58.95 by the 29th. In the selloff that followed, the bulls were unable to save that support, plus the 50- and 200-day.
Friday, buyers showed up near November 2017 lows. Immediate resistance lies at the 200-day (55.42), which is flattish to ever so slightly dropping.
XLU (SPDR utilities ETF)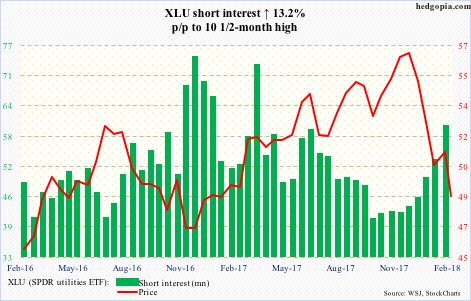
XLU (48.56) peaked as early as November 15 last year at 57.23. By December 20th, it had lost both the 50- and 200-day, followed by a death cross by the 26th. Last week’s low of 47.37 successfully tested a rising trend line from March 2009 lows.
Nearest resistance lies at 50. Rally odds grow particularly if 10-year yields begin to drop – which is looking very likely.
Short interest has risen to a 10 ½-month high. There is room for squeeze.
XLV (SPDR healthcare ETF)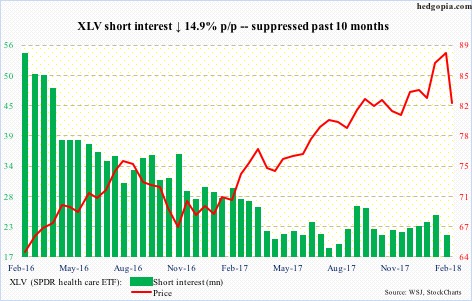
In January, XLV (82.10) rallied 6.6 percent, but at the same time produced a candle with a very long wick. February-to-date, it is down 6.8 percent. The 200-day was tested last Friday and saved. There is resistance at 84, and after that the 50-day (85.05).
XLY (SPDR consumer discretionary ETF)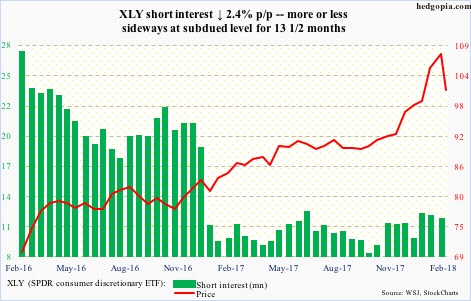
After breaking out of 92+ last November, XLY (100.83) went parabolic, before peaking at 109.34 on January 29th. In the subsequent decline, the 50-day was lost but last Friday’s reversal brought the ETF within 0.8 percent of that average. The 200-day (93.35) was not even remotely tested.
Thanks for reading!
