
Here is a brief review of period-over-period change in short interest in the May 1-15 period in nine S&P 500 sectors.
XLB (SPDR materials ETF)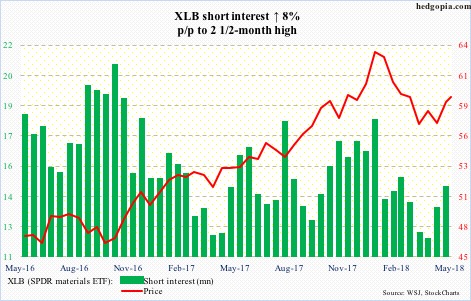
Two weeks ago, XLB (59.33) broke out from a late-January falling trend line, but building on it has proven tough. The ETF Monday faced resistance at the daily upper Bollinger band, failing to take out prior high from April 18, hence no higher highs.
The 200-day lies at 58.61. A test looks imminent.
XLE (SPDR energy ETF)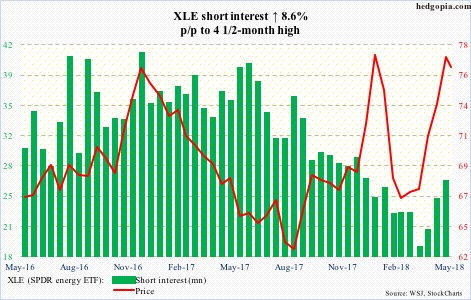
Tuesday, XLE (76.57) rallied intraday to three-year high 79.42, but only to reverse and end the session with a bearish engulfing candle.
Shorts have been gradually adding, and they may be onto something. This has the potential to be a major top. For now, nearest short-term support lies at 74.50-ish.
XLF (SPDR financial ETF)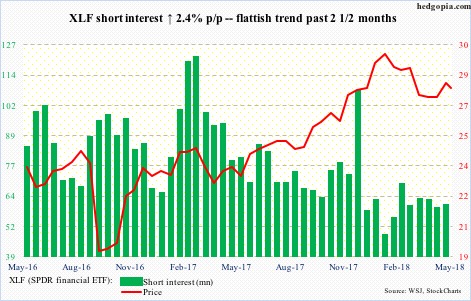
Unlike the S&P 500 and many of its sector peers, XLF (27.94) still lies beneath a trend line from late January, failing to go toe-to-toe with 10-year Treasury yields, which jumped from 2.72 percent on April 2 to 3.12 percent on May 17.
Thursday, the 50-day (27.78) was tested and saved, although the path of least resistance near term is down. The 200-day lies at 27.27.
XLI (SPDR industrial ETF)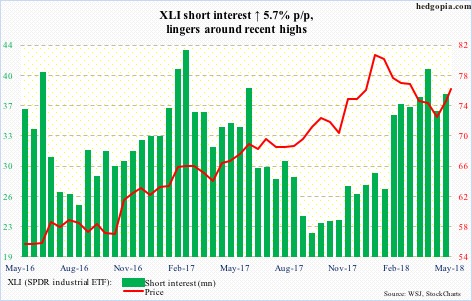
Since February 9, XLI (75.83) has made lower lows. From the low of May 3, it rallied nicely, which stopped this Monday just outside the daily upper Bollinger band. The 10-day was defended in subsequent sessions.
Shorts have gotten aggressive the last several months. The bulls would cherish a squeeze, but the daily chart is itching to go lower near term.
XLK (SPDR technology ETF)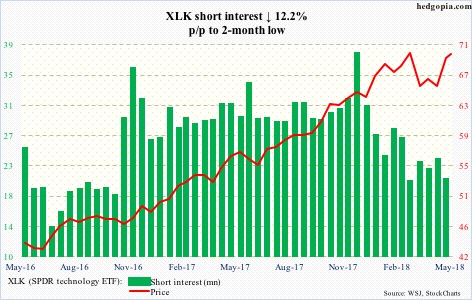
On May 14, XLK (69.80) rallied to 70.42, coming close to testing its all-time high of 71.34 from March 13. Since that unsuccessful test, the ETF has come under pressure, but the bulls are hanging tough.
For the last several sessions, bids have appeared just under 69, with not much help from the bears. Short interest is relatively low compared to how it was in the latter months of last year.
XLP (SPDR consumer stables ETF)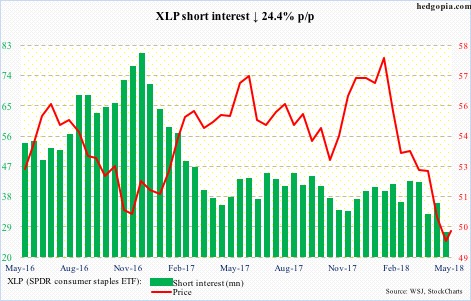
Since peaking at 58.95 on January 29 through the intraday low of 48.76 on May 3, XLP (49.80) collapsed 17-plus percent. Since that low, it has trended higher in a channel. The bears hope this in due course turns out to be a flag.
With that said, the weekly chart is beginning to favor the bullish case. With one session to go, this week’s candle is a doji, preceded by a spinning top and two back-to-back hammers before that.
XLU (SPDR utilities ETF)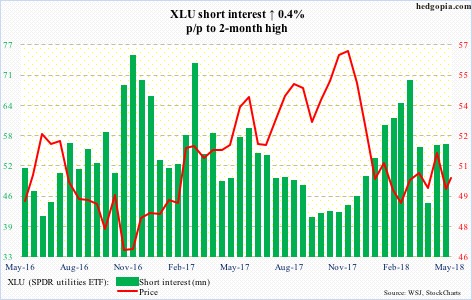
Beginning early February, XLU (50.28) played ping pong within an ascending channel for three months, before falling out early this month. The recent rise in interest rates dealt a crushing blow to bond proxies including utilities.
Ten-year T-yields peaked on May 17. XLU bottomed a day later. It closed Thursday right on the 50-day. There is room to rally further near term. The underside of the afore-mentioned channel gets tested around 51.
XLV (SPDR healthcare ETF)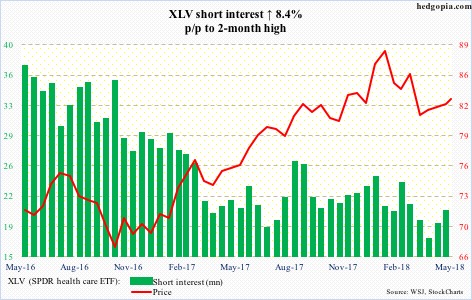
XLV (83.06) has straddled the 200-day (82.88) for two weeks now, with 84 providing stiff resistance. Down below, 79-plus has consistently attracted bids since reaching a reversal low on February 9. Too soon to say if that support gets tested again in days/weeks ahead, but near term it is the bears’ ball to lose. Short interest has inched up in the past month.
XLY (SPDR consumer discretionary ETF)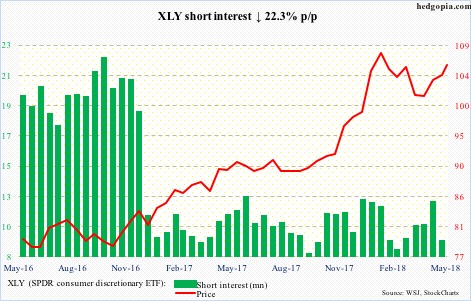
XLY short interest is already very low, which went lower in the reporting period. The ETF was only up 0.8 percent during May 1-15, while short interest fell 22.3 percent. Tough to say if they expect XLY (105.97) to continue to rally, but it is way extended on the daily chart.
Thanks for reading!
