
Here is a brief review of period-over-period change in short interest in the June 1-15 period in nine S&P 500 sectors.
XLB (SPDR materials ETF)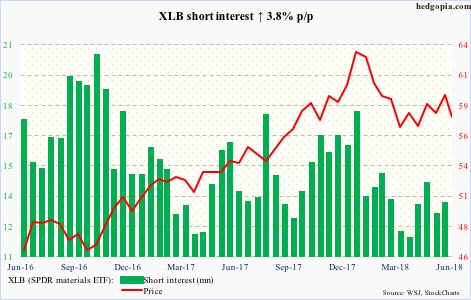
Monday, XLB (57.83) bounced off the daily lower Bollinger band. The daily chart is oversold. The ETF is below both its 50- and 200-day moving averages. Two weeks ago, it was unable to surpass its mid-March high.
XLE (SPDR energy ETF)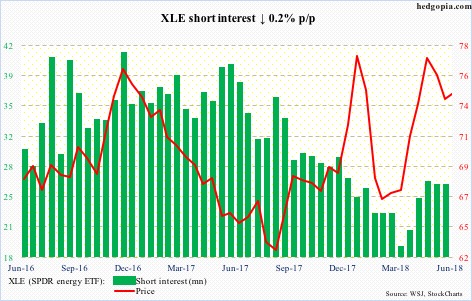
Mid-May, XLE (74.57) broke past 78-79 resistance, but only fleetingly. The false breakout came in a huge bearish engulfing week. In the past several sessions, bulls defended the daily lower Bollinger band. There is decent support at 72.50-ish.
XLF (SPDR financial ETF)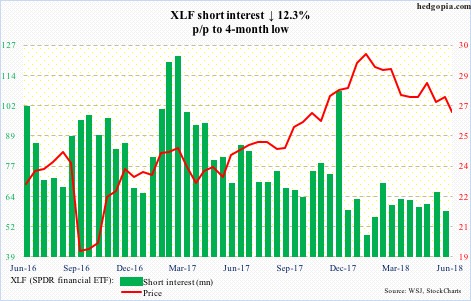
XLF (26.69) is teetering on support. The ETF peaked at 30.33 on January 29, followed by a reversal low of 26.76 on February 9. That low was slightly breached in early April and early May, but with 26.50-ish drawing bids. It is being tested again. Bears keep hammering on that support, and it is a must-hold.
XLI (SPDR industrial ETF)
Since XLI (71.96) dropped intraday from 80.96 to 71.49 in a couple of weeks, bears have forced a test of that low several times, including this Monday – so far successfully. The daily chart has room to head higher. But with the 50- and 200-day likely just a few sessions away from forming a death cross, bulls have their work cut out.
XLK (SPDR technology ETF)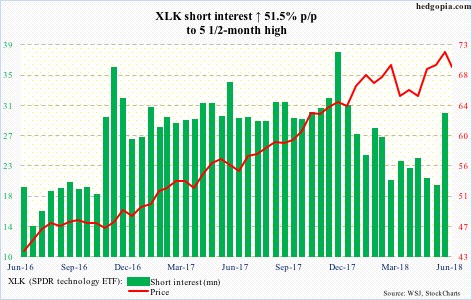
Since flashing a weekly doji two weeks ago, XLK (69.61) has come under pressure. The 50-day was breached Monday intraday but saved by close. In the right circumstances, the ETF can rally near term. The latest spike in short interest can come in handy, if bulls force a squeeze. Medium term, the weekly chart has plenty of room to continue lower.
XLP (SPDR consumer stables ETF)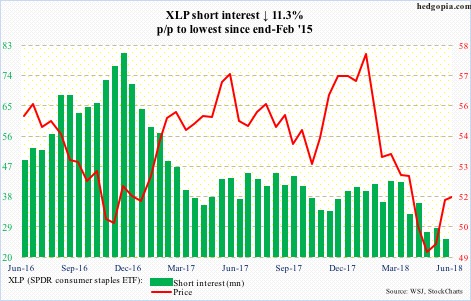
XLP (51.67) went from 58.95 on January 29 to 48.76 on May 3. Bulls should find the rally since that low constructive, except the daily chart is overbought. They need to defend support at just south of 51. The 50-day rests at 50.37.
XLU (SPDR utilities ETF)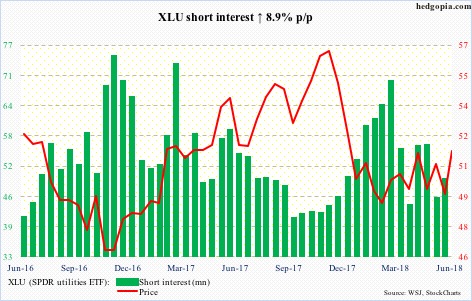
Following defense of support at 48 on the 7th this month, XLU (51.65) shot up in pretty much a straight line, recapturing the 50-day and currently testing the 200-day. Tuesday’s intraday high of 51.95 fell a penny short of the prior high from April 30. Bulls want to see a takeout of this resistance. The daily chart is getting extended.
XLV (SPDR healthcare ETF)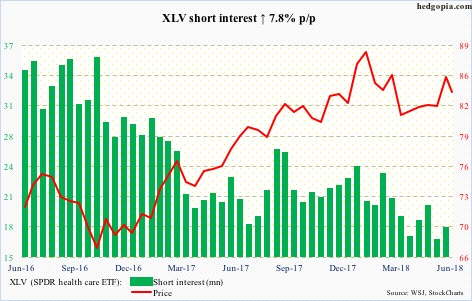
In the middle of this month, XLV (83.89) was repelled at the upper end of a rising three-month channel. The subsequent drop had it test the 200-day (83.38) this Monday. The 50-day lies just underneath. Weekly momentum indicators are overbought. A test of the lower bound of that channel takes place around 81.50.
XLY (SPDR consumer discretionary ETF)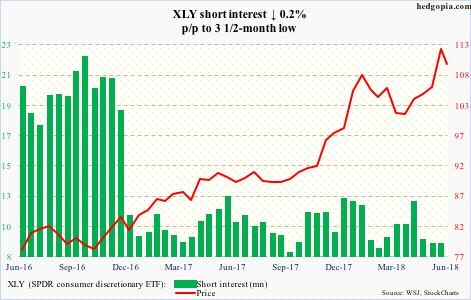
On June 21, XLY (109.68) rose to a new intraday high of 112.62, only to see it reverse and end the session down 0.7 percent, followed by more selling in the next couple of sessions. The intraday low this Monday tested – successfully – a rising trend line from early April, but it is hardly all-clear. Overbought weekly momentum indicators have a long way to go before they get unwound.
Thanks for reading!
