
Here is a brief review of period-over-period change in short interest in the July 2-13 period in nine S&P 500 sectors.
XLB (SPDR materials ETF)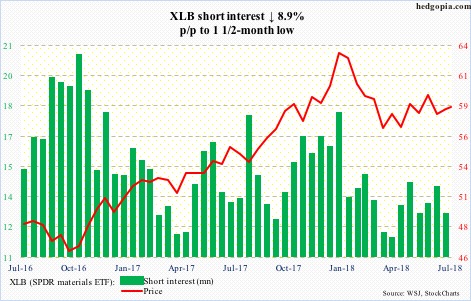
After defending support at $57-plus late June, XLB ($58.72) subsequently rallied past both 50- and 200-day moving averages, but that did not last very long. The 50-day denied rally attempts the last several sessions, with the 200-day above. For now, the ETF remains trapped between $60 and $58, which respectively represent a falling trend line from late January and a rising one from late March.
XLE (SPDR energy ETF)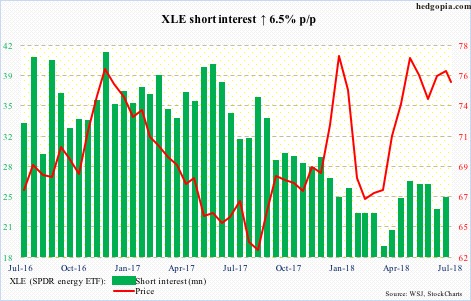
Resistance at $78-79 on XLE ($75.50) has proven tough to crack since last December, including one 10 sessions ago. The 50-day is gradually rolling over. The average was tested Tuesday – unsuccessfully. There is support at $74-plus, followed by $72.50-ish.
XLF (SPDR financial ETF)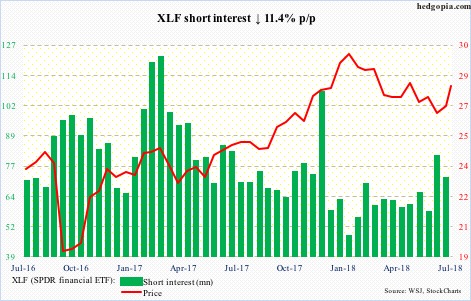
In the second half of June, XLF ($28.02) short interest rose to a six-and-a-half-month high. Toward the end of that month, support at $26.50-ish was briefly breached, but turns out that was a false breakdown. July-to-date, the ETF is up 5.4 percent, helped by slight widening in the Treasury yield curve (10s/2s). It has even broken out of a falling trend line from late January. All good, except the daily chart is extended.
XLI (SPDR industrial ETF)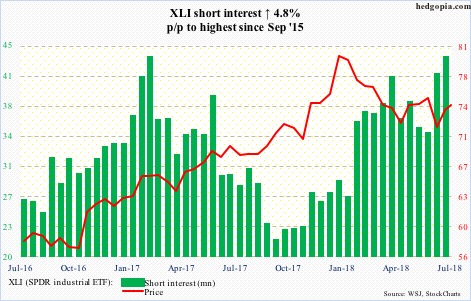
Toward the end of June, support at $71-ish was once again tested, and it held. The rally that followed did not deter the shorts a bit. XLI ($74.29) short interest rose to the highest since September 2015. At least near term, they can afford not to get afraid of a squeeze. The last several sessions, the 200-day repelled rally attempts. Near term, daily momentum indicators are overbought.
XLK (SPDR technology ETF)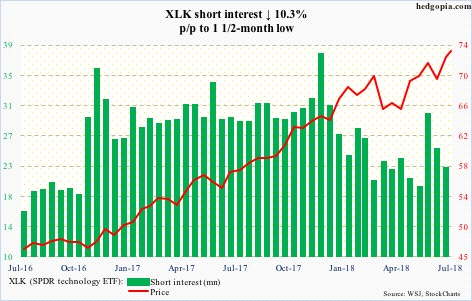
Yet another high on XLK ($73.32) – rose Tuesday to a new all-time high of $73.94 but closed poorly. During the reporting period, shorts continued to cut back. The daily chart is extended. Bulls need to defend Tuesday’s low of $73.01. Else, unwinding of overbought conditions can begin.
XLP (SPDR consumer staples ETF)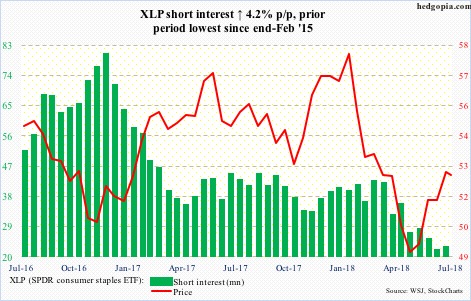
XLP ($52.63) rallied nicely since bottoming early May at just under $49, but resistance at $52.50-53 is yet to give away. Odds are the status quo continues near term. Shorts continue to stay on the sidelines, so there is not much chance of a squeeze. With daily conditions overbought, the MACD just developed a potentially bearish cross-under. Channel support lies at $51, which approximates the 50-day.
XLU (SPDR utilities ETF)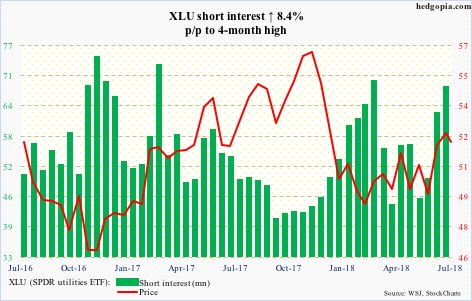
XLU ($52.10) short interest jumped to a four-month high. Since bottoming at north of $48 early June, the ETF rallied strongly, only to hit the wall just north of $53. There is support around $52, with the 200-day at $51.71. This needs to hold.
XLV (SPDR healthcare ETF)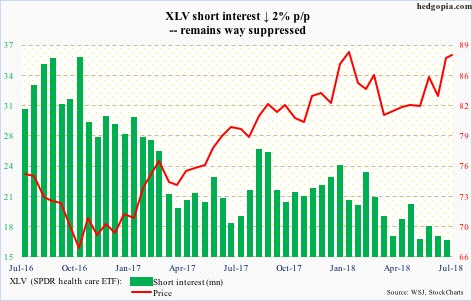
Since early February, XLV ($87.73) bulls defended the $79 area several times before a sustained rally began early May. Shorts have been right in pretty much staying out of it. Near term, the daily chart is overbought, but the bears need to push it under $87.50-ish to increase their chances.
XLY (SPDR consumer discretionary ETF)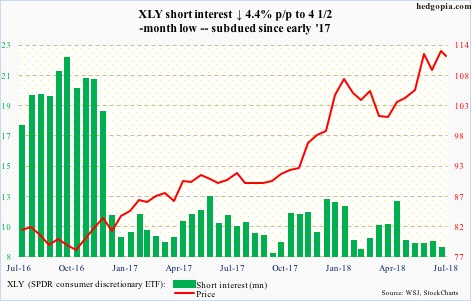
XLY ($111.70) broke out of $109 early June, and rallied to a new intraday high of $113.31 last Wednesday. Shorts have lied low since early 2017. Rightly so. Last week’s high came in a long-legged doji session. The ETF is itching to go lower near term. Immediate support lies at $110.50, which is about where a rising trend line from early April gets tested. The 50-day rests at $109.36.
Thanks for reading!
