Here is a brief review of period-over-period change in short interest in the October 1-15 period in nine S&P 500 sectors.
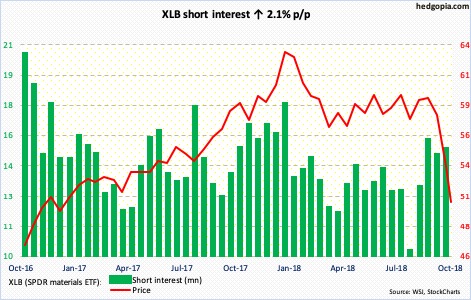
Three weeks ago, XLB (50.51) fell out of a slightly rising ascending channel. The drop since has been waterfall-like, losing one after another support, including 54.60. Daily momentum indicators are extremely oversold, but the ETF needs to stabilize first. Should one occur, nearest resistance lies at 52.50.
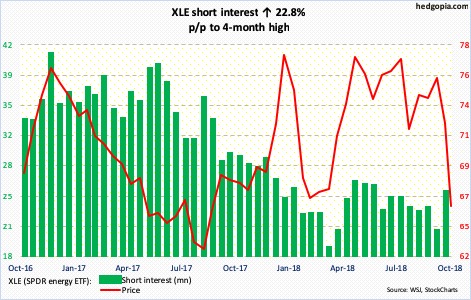
Two weeks ago, resistance at 77-78 was once again tested – unsuccessfully. Since then, both the 50- and 200-day moving averages have been lost. Ditto with horizontal support at 71-72. This week, XLE (66.17) sliced through a rising trend line from February 2016. There is support at 65.
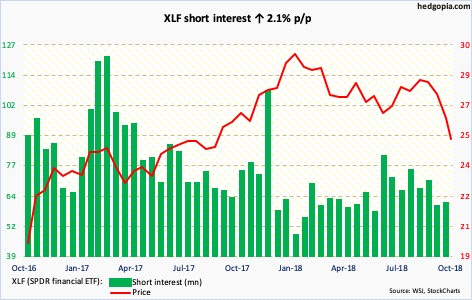
XLF (25.24) finds itself at a critical juncture. Since September 20 when it traded intraday at 29.07, it has had quite a drop. This week, support at 26 was gone. With this, it currently sits at a rising trend line from the lows of March 2009. Right around there lies horizontal support at 25, which it broke out of in September last year. It is a must-save.
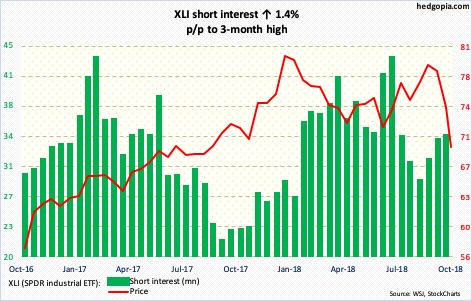
XLI (69.30) traded within a rectangle from pretty much the beginning of the year. It fell out of it Wednesday. If a measured-move approach of this breakdown fulfills, a technician in due course would be eyeing 62-63. That is a long way from here.
The lower bound of the broken box lies at 71.50-ish. Should things stabilize near term, that is where bulls and bears will lock horns. Needless to say, momentum rests with the latter currently.
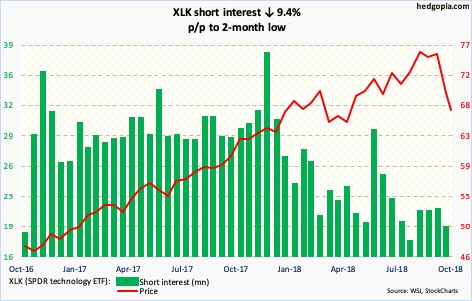
Wednesday, XLK (67.17) undercut the intraday low of October 11. Monday’s attempt to rally was denied at the underside of a broken trend line from February this year. Interestingly, the selling so far this month cannot be blamed on shorts. Short interest went down 9.4 percent in October 1-15. In a worse-case scenario near term, 65 could be in play; this is where trend-line support from February 2016 lies.
XLP (SPDR consumer staples ETF)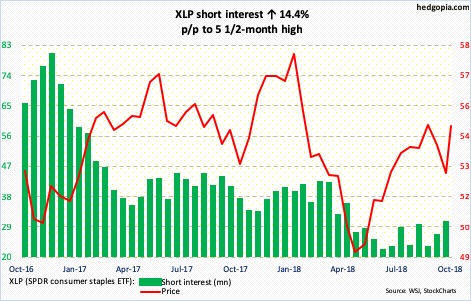
XLP (54.75) has benefited from risk-off sentiment the past couple of weeks. After rallying 4.2 percent last week, it is up 0.1 percent so far this week. Wednesday, however, it was once again denied at two-plus-year resistance at 55-55.50, resulting in a candle with a long upper shadow. For now, the daily is itching to go lower. The 50-day lies at 54.12.
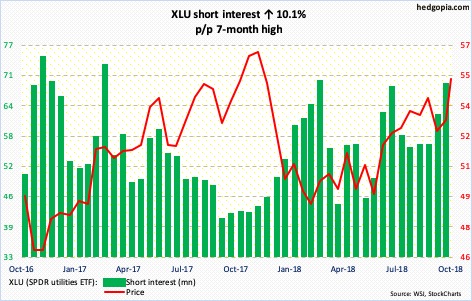
As is the case with consumer staples, utilities have caught bids the past couple of weeks. XLU (55.23), in fact, rallied 2.4 percent Wednesday, past resistance at just under 55. It is possible shorts lent a helping hand. Mid-October, short interest was at a seven-month high.
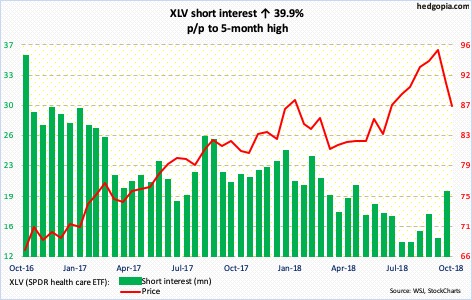
XLV (87.29) opened October with an intraday high of 96.06. The drop since has cost the ETF its 50-day. The 200-day (86.74) is a stone’s throw away. In the latest reporting period, shorts got a little aggressive, and have been rewarded. This will be a first test since July this year. Right around there also lies horizontal support.
XLY (SPDR consumer discretionary ETF)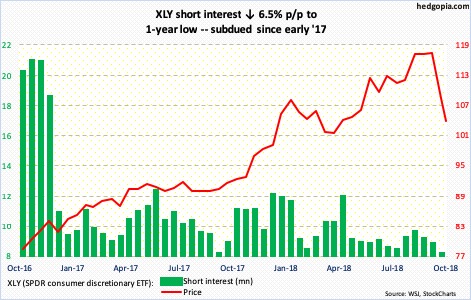
XLY (103.60) rose to a new intraday high of 118.13 on October 1, only to then progressively head lower. Month-to-date, it is down 11.6 percent, with an ominous looking monthly engulfing candle. Shorts are still not interested. Short interest – sub-nine million – is at a one-year low. When selling stops, bulls are not going to get any help from short interest.
Thanks for reading!

