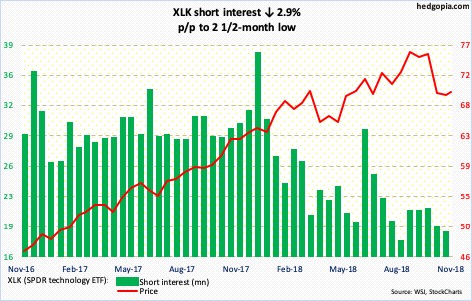
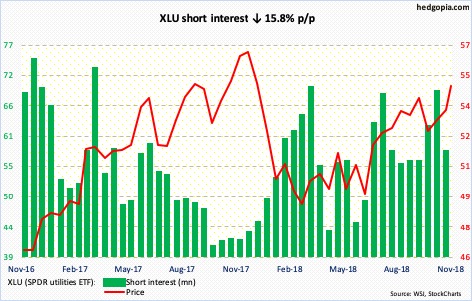
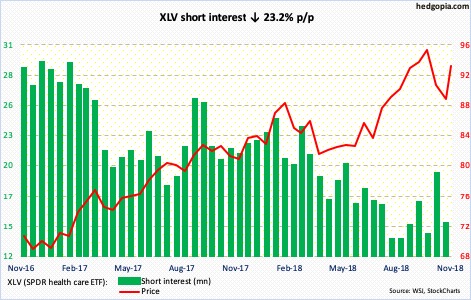
Here is a brief review of period-over-period change in short interest in the October 16-31 period in nine S&P 500 sectors.
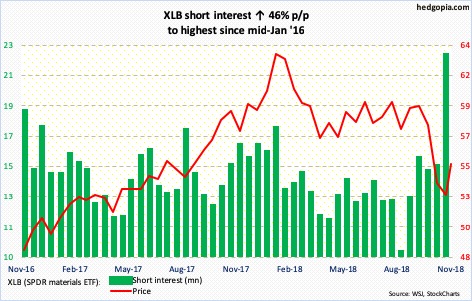
During October’s selling, XLB (54.98) went on to lose horizontal support at 56. This preceded a drop out of a slightly rising ascending channel. Pumped up, shorts aggressively added to short interest. The rally in the early part of November likely caused some squeeze. If bulls had their way, squeeze can continue. But the broken-support-turned-resistance at 56 already acted as a roadblock, as the ETF last Wednesday turned back after touching 56.03. The daily chart is overbought.
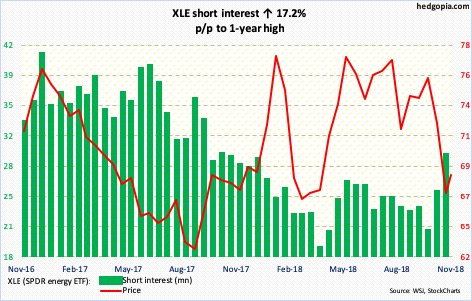
Since December 2016, XLE (68.50) has been rejected at 78-plus several times, including a month ago. The subsequent selling last month stopped at 64-plus support. Both last week and the week before produced candles with long upper and lower shadows – encouraging from bulls’ perspective, having come after October’s rout. In the event of a rally, there is resistance at just north of 70.
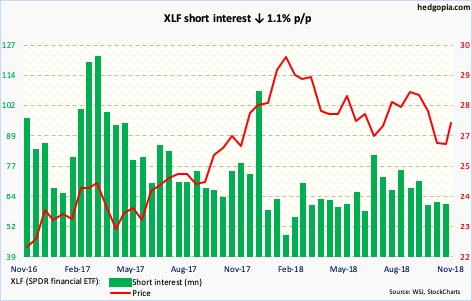
In September last year, XLF (27.12) broke out of 25, culminating in a rally to 30.33 by January this year. As the ETF came under pressure last month, bulls defended breakout retest toward the end of the month. A decent rally followed. This has pushed the ETF into overbought territory on a daily basis. Last week, the 50-day was tested – unsuccessfully.
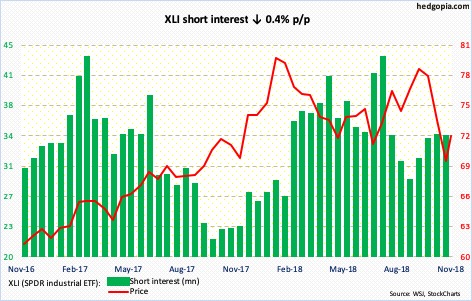
XLI (72.42) traded within a rectangle from pretty much the beginning of the year, which it fell out of during last month’s collapse. If a measured-move approach of this breakdown fulfills, a technician in due course would be eyeing 62-63. After stabilizing late last month near 67, XLI crawled its way back into the box. Short interest is decent enough to cause a squeeze should bulls recapture momentum. But the daily is beginning to look extended.
From an all-time high of 76.27 on the 3rd to 65.59 on the 29th, XLK (69.84) had a rough October, losing one after another support. In the rally the past couple of weeks, the ETF retook the 200-day, but only for a couple of sessions. Last Friday, the average was lost; bulls at the same time defended the 10-day. That said, unlike in the past, they are not going to get much help from short interest, which remains subdued – relatively.
XLP (SPDR consumer staples ETF)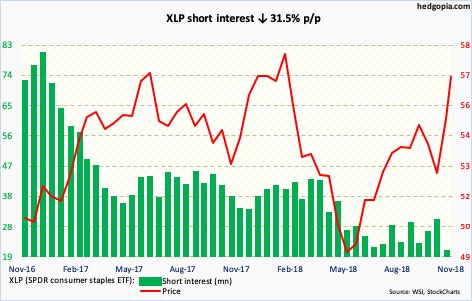
For over two years now, XLP (56.82) found it difficult to take out 55-55.50. The resistance gave way early this month. Short interest – already suppressed – likely contributed. There is resistance at just north of 57, with the daily itching to go lower. Breakout retest will be important.
XLU (54.87) had a positive October. As was the case with consumer staples, utilities caught bids as other sectors got hammered. Currently, it is right under resistance at 55. A breakout can lead to a squeeze. Short interest remains relatively high.
XLV (92.95) opened October with an intraday high of 96.06. The subsequent pressure it came under stabilized toward the end of the month near the 200-day. On the weekly, there is room for continued rally, but the daily is getting extended. There is short-term resistance at 94, which was just about tested last Thursday.
XLY (SPDR consumer discretionary ETF)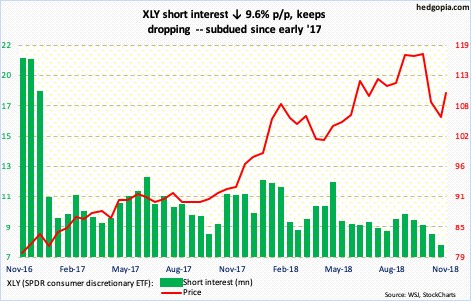
XLY (110.02) produced an ominous-looking candle in October. During the month, short interest – as subdued as it is already – dropped another 15.5 percent. Shorts used the10.1-percent decline in the ETF as an opportunity to cover. This also means potential squeeze fuel is increasingly less and less. The ETF’s rally the past couple of weeks stopped last Thursday at the 50-day. The 200-day (108.44) lies below, where a bull-bear duel is likely to unfold.
Thanks for reading!

