
Here is a brief review of period-over-period change in short interest in the November 1-15 period in nine S&P 500 sectors.
XLB (SPDR materials ETF)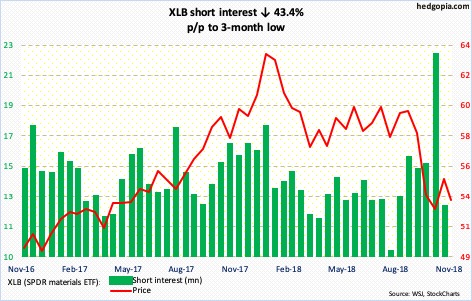
After a horrendous October, XLB (53.26) bulls defended horizontal support at 50 toward the end of the month. The subsequent rally has been denied twice at the now-declining 50-day moving average. In the reporting period, shorts covered the prior period’s buildup and then some. In the event of a rally, they likely will step up near 55.
XLE (SPDR energy ETF)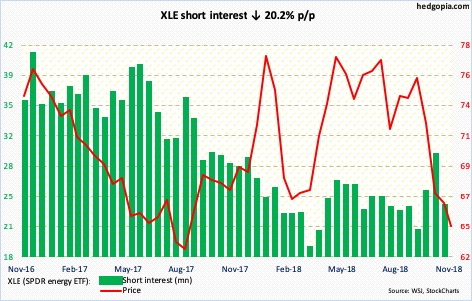
Post-late October low, XLE (64.69) rallied, but only to get rejected at the underside of a rising trend line from February 2016 which was broken during last month’s rout. Bulls are trying to put their foot down. As is spot West Texas Intermediate crude.
Last Friday, the ETF fell to a 15-month low of 63.44, before attracting some bids. Bulls need to defend 64.
XLF (SPDR financial ETF)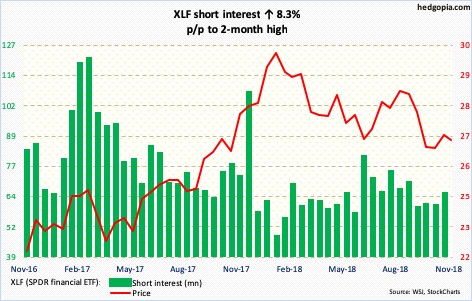
In September last year, XLF (26.55) broke out of 25, culminating in a rally to 30.33 by January this year. During October’s selloff, there was a successful breakout retest toward the end of the month.
Currently, XLF sits near support at 26.50-ish. Continued defense of this in due course opens the door to a test of a falling trend line from January around 28. The 200-day lies at 27.69.
XLI (SPDR industrial ETF)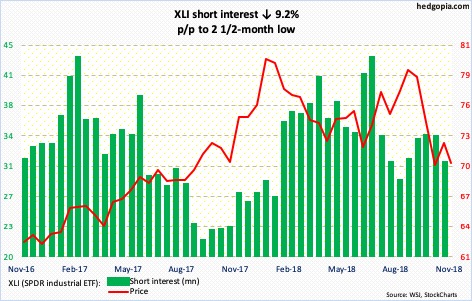
XLI (70.12) traded within a rectangle from pretty much the beginning of the year, which it fell out of last month. If it is a genuine breakdown, a measured-move approach puts the downside target at 62-63. Thus the significance of 71-72 for both bulls and bears. For now, shorts are staying put – kind of.
XLK (SPDR technology ETF)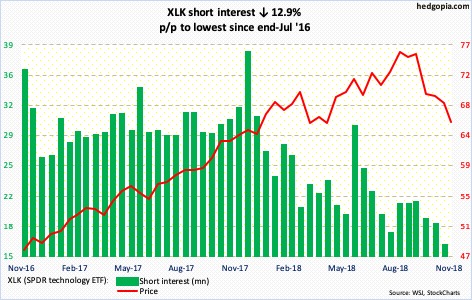
XLK (65.66) collapsed six percent in October. November-to-date, it is down another 5.3 percent. Monthly momentum indicators have decidedly turned lower and may have a ways to go. Near term, however, the ETF is trying to stabilize. There is plenty of resistance overhead where shorts can reappear. Nearest – and short-term – resistance lies just north of 66.
Short interest currently is the lowest since end-July 2016. Bulls are not going to get much help from this.
XLP (SPDR consumer staples ETF)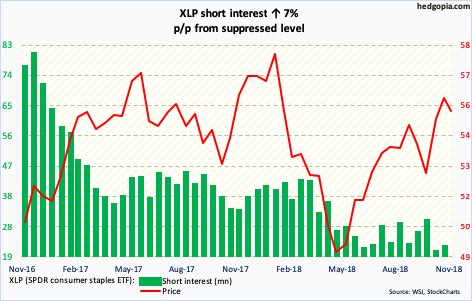
For nearly two and a half years now, 55-55.50 has proven to be an important level on XLP (55.35). After reaching a new all-time high of 58.95 on January 29 this year, it fell to 48.76 on May 3. Once again, bulls and bears are locked into battle near that level. Shorts have pretty much moved to the sidelines, even as longs are trying to stay above the 50-day (54.66).
XLU (SPDR utilities ETF)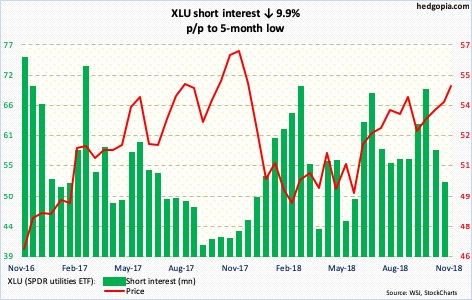
XLU (54.84) rallied two percent in October, and another 2.1 percent November-to-date. Shorts have cut back in the past month. Currently, the ETF is right under resistance at 55. A breakout can lead to a squeeze. Barring that, the weekly chart is itching to go lower.
XLV (SPDR healthcare ETF)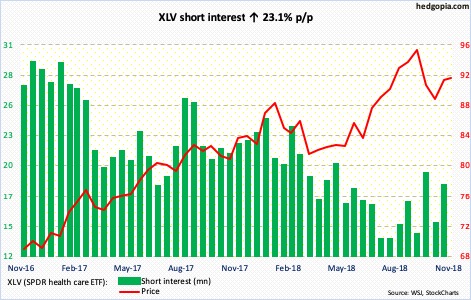
During the October selloff, the 200-day was defended on XLV (91.45). Early this month, bulls recaptured the 50-day (91.86), but staying above has proven difficult. The average also approximates a falling trend from the all-time high of 96.06 reached on October 1. A breakout will open the door to a test of the daily upper Bollinger band (93.41).
XLY (SPDR consumer discretionary ETF)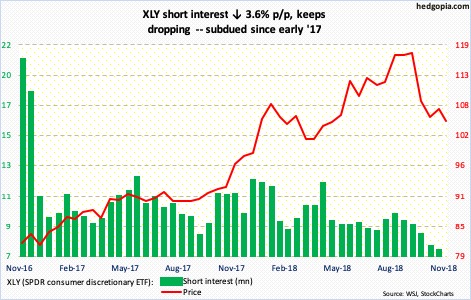
Despite an ominous-looking candle in October, XLY (104.62) shorts are still not interested. Short interest went down in the reporting period. Bulls managed to defend the 100 level. The daily chat is oversold.
Thanks for reading!
