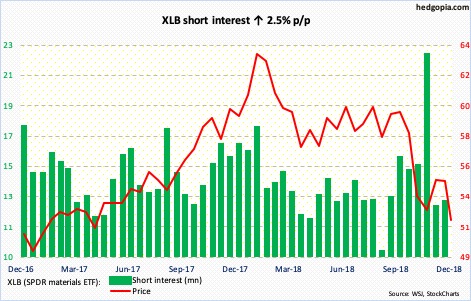
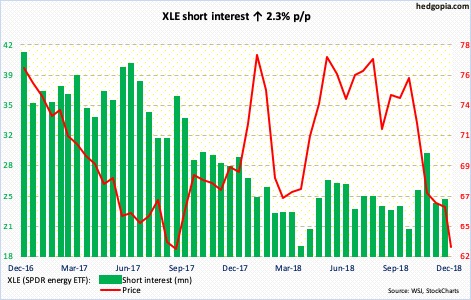
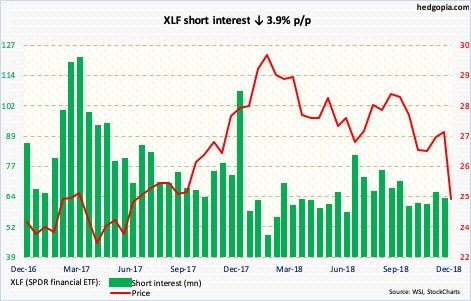
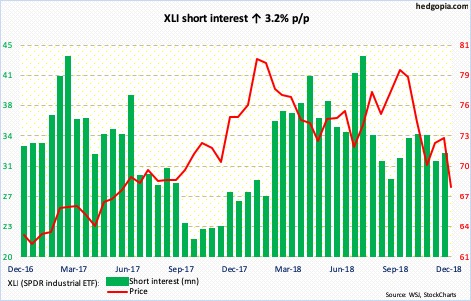
Here is a brief review of period-over-period change in short interest in the November 16-30 period in nine S&P 500 sectors.
XLB (51.88) fell out of multi-month horizontal support at 55-56 during October’s selling. Shorts are now using that breakdown to go short. They showed up just north of 56 early November as well as early this month.
Late-October lows are intact on the ETF. The daily chart is getting oversold. In the event of a rally, bulls need to first recapture 53.25-ish before even thinking about testing 55-56.
XLE (63.09) is testing the lows of August last year. So far so good. Bulls were unable to save 64, which is where shorts appeared in the past couple of sessions. Monday’s intraday low of 61.62 is crucial – because this is where a rising trend line from July 2002 sits.
In September last year, XLF (24.52) broke out of 25, culminating in a rally to 30.33 by January this year. This breakout is seriously being tested. Late October, bulls defended that level, but are struggling this time around. They cannot afford to lose it, as the current level also approximates trend-line support from the lows of March 2009.
XLI (67.80) fell out of months-long rectangle in October. The low end of that box lied at 71-72. If it is a genuine breakdown, a measured-move approach puts the downside target at 62-63. Bears continue to attack every opportunity they get. Early this month, they showed up at the 200-day moving average just south of 74.50. Thus far, bulls have defended late-October lows. Things ought to remain this way if they are to go test 71-72.
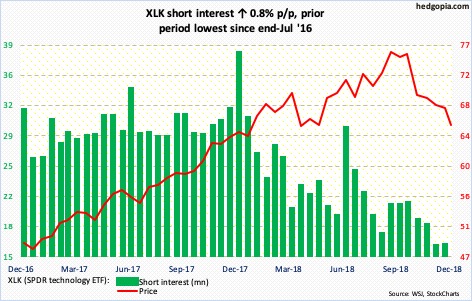
XLK’s (65.57) monthly momentum indicators have decidedly turned lower. This is longs’ medium- to long-term worry. The weekly, on the other hand, is oversold and could rally in the right circumstances. As long as 64 is defended, odds favor bulls near term. But not much help would be forthcoming from short interest as it remains low.
XLP (SPDR consumer staples ETF)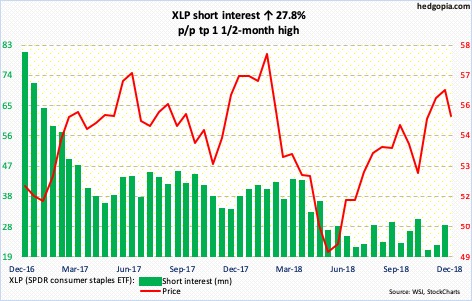
XLP (55.17) bulls and bears continue to fight over control of the 50-day (54.86). The average also approximates 55-55.50, which for nearly two and a half years has acted like a magnet. If bulls win this duel, the two then are likely to lock horns around 57, which makes up left and right shoulders of a potential head-and-shoulders formation in the making.
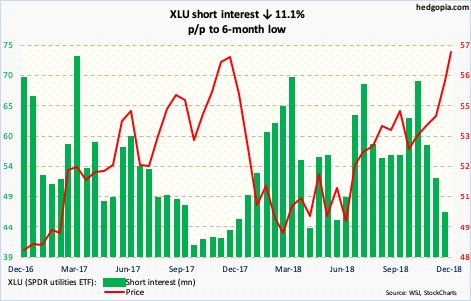
XLU (56.80) broke out of three-month resistance at 55 late November, and is a stone’s throw away from surpassing its all-time high of 57.23 reached in November last year. Shorts have cut back the past month and a half, but short interest is elevated enough for a potential squeeze should bulls force a breakout.
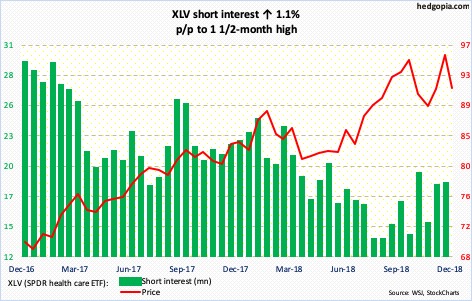
Five sessions ago, XLV (91.19) came within 15 cents of surpassing its all-time high of 96.06 that was hit on October 1. This could potentially be an important failure. Shorts have been slightly adding in the past three to four months but have not gotten aggressive. Support at 88.50-ish is crucial in this regard.
XLY (SPDR consumer discretionary ETF)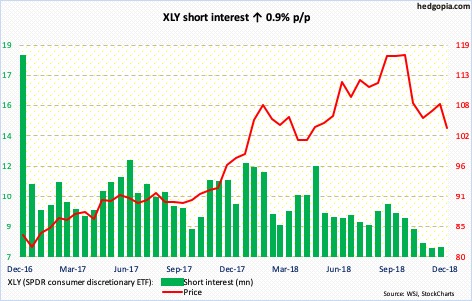
XLY (103.49) has come under decent pressure since peaking at 118.13. on October 1. That said, bulls have put their foot down around 101. Shorts continue to act indifferent, but maybe will get interested if 101 gives away.
Thanks for reading!

