
Here is a brief review of period-over-period change in short interest in the January 2-15 period in 10 S&P 500 sectors.
XLB (SPDR materials ETF)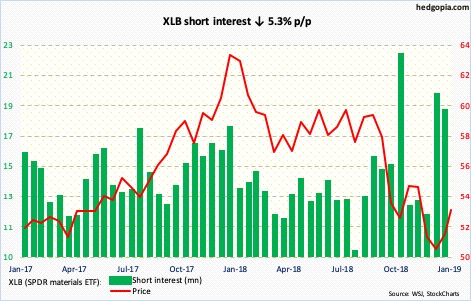
XLB (53.12) five sessions ago recaptured a falling trend line from last September. In the reporting period, shorts cut back a little, but short interest remains elevated. It is possible they have gotten squeezed since January 15. The ETF is up 3.1 percent in the current period. There is short-term resistance at 53.50s. A convincing breakout can further squeeze the shorts near term.
XLE (SPDR energy ETF)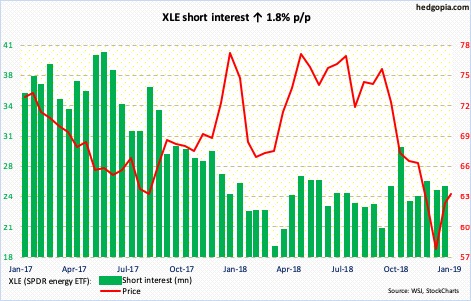
Since bottoming at 53.36 on Boxing Day, XLE (62.93) has rallied nicely, with an intraday high of 63.89 on January 18. The ETF has retaken the 50-day moving average (62.40), but barely. Decent resistance lies at 64-plus. The daily is extended.
XLF (SPDR financial ETF)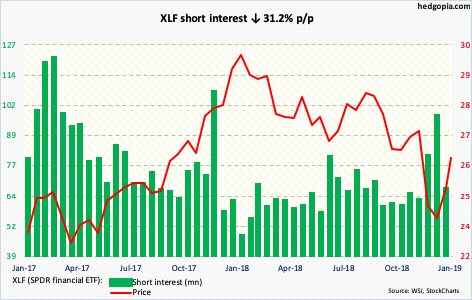
XLF (26) jumped 4.5 percent between December 31 and January 15. Shorts fled, with short interest declining 31.2 percent. Since then, it has rallied another 4.5 percent. From bulls’ perspective, the good thing is that major support at 25 has been recaptured, but it remains to be seen if this was primarily due to short squeeze. Daily momentum indicators are deeply overbought. The 50-day rests at 25.13.
XLI (SPDR industrial ETF)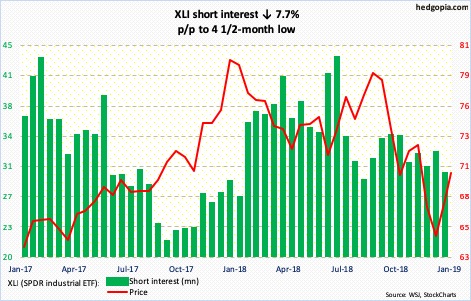
XLI (70.07) retreated five sessions ago after rallying intraday to 70.44. The subsequent selloff was defended at/near the 50-day/short-term horizontal support. The daily upper Bollinger band rests at 71.25, which approximates major resistance at 71-72. A test of this would have pushed the daily into deep overbought territory.
XLK (SPDR technology ETF)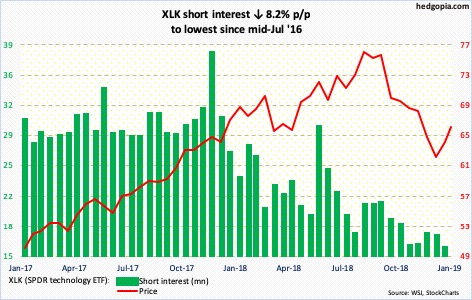
Shorts continue to turn tail. Short interest is the lowest since mid-July 2016. XLK (65.93) has rallied the past five weeks, even as potential squeeze fuel is running dry. The daily is extended. There is support in the 64 area, with the 50-day plus short-term horizontal support lying there.
XLP (SPDR consumer staples ETF)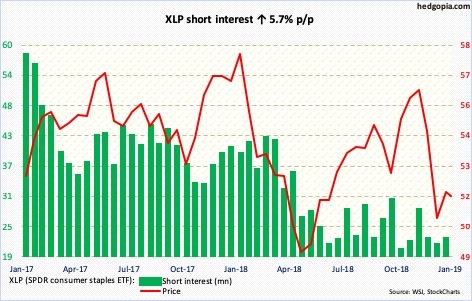
Last month, bulls defended the neckline of a potential head-and-shoulders pattern on XLP (51.73). The rally since had them test the 200-day (52.79) twice in the past five sessions – unsuccessfully. The daily is itching to go lower.
XLRE (SPDR real estate ETF)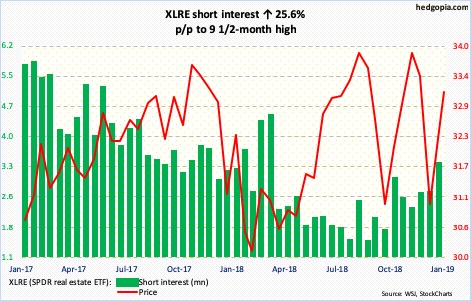
A rising trend line from March 2009 was broken in January last year on XLRE (33.13). The subsequent selling stopped at 29 and change. Support at 29.50 goes back three years. Above, bulls have faced resistance at 34 Since June 2016. So essentially the ETF is caught in a rectangle, even though there is a trend break. The lower bound was tested as recently as a month ago, followed by a decent rally. In the very near term, there is support at 32.80s.
XLU (SPDR utilities ETF)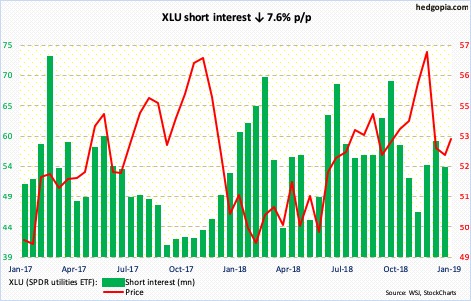
On XLU (53.32), bulls face decent resistance at 54.50-55. The 50-day lies at 54.18, which was unsuccessfully tested last Friday. The daily looks like it wants to go lower. The 200-day lies at 52.69.
XLV (SPDR healthcare ETF)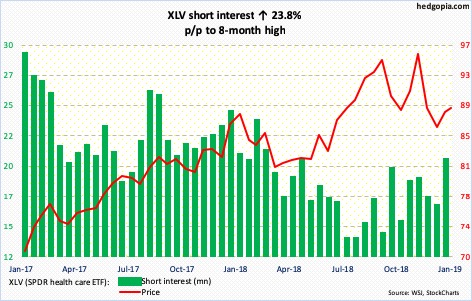
After four weeks of rally, XLV (88.92) shed 1.3 percent last week. Ahead of this, short interest rose to an eight-month high. For this aggression to pay off, they need to push the ETF under both the 50- and 200-day (88.93 and 88.10, in that order).
XLY (SPDR consumer discretionary ETF)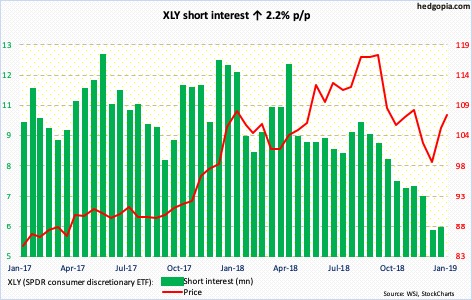
XLY (107.03) is sandwiched between the 50- and 200-day. Having rallied nearly 17 percent since Christmas Eve, the ETF is beginning to give out signs of fatigue, but momentum is yet to break. In the event of loss of the 50-day, there is decent support at 101-102.
Thanks for reading!
