
Bulls’ mettle was tested this week. With two more sessions to go, they came up short. A bigger test lies ahead.
Major US equity indices broke down this week. Bulls’ resolve was seriously tested on Tuesday and Wednesday – simply unable to cope with the amount of sell orders that came their way. This has cost them important support.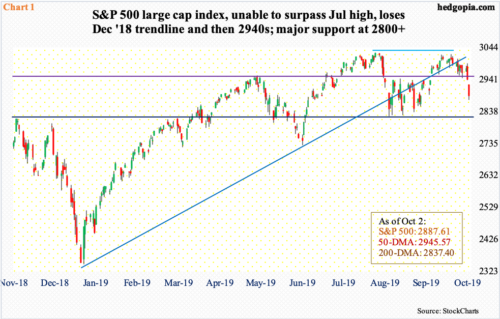
Toward the middle of September, the S&P 500 large cap index (2887.61) tried twice to take out its all-time high of 3027.98 from July 26, but in vain. For several sessions, the subsequent weakness stopped at dual support consisting of the 50-day and 2940s. Tuesday, the index literally closed on that support, which fell Wednesday (Chart 1).
Between the July high and Wednesday’s low, the index lost just north of five percent. The daily is getting oversold, but not the weekly. Weekly momentum indicators can continue lower. Hence the significance of where the S&P 500 sits currently.
The 200-day rests at 2837.40, which lies in the vicinity of crucial support just north of 2800. For a year and a half now, this level has proven to be an important price point for bulls and bears alike. Should bulls put foot down, what transpires around 2940s will be equally important.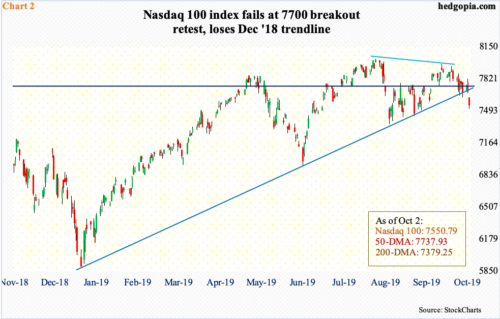
Things evolved similarly on the Nasdaq 100 index (7550.79). It peaked at 8027.18 on July 26. On September 12, it came within 52 points of that high, but only to reverse hard. This was followed by a similar reversal on the 19th. Fatigue was written all over the index, with a weekly spinning top three weeks ago.
This week, after straddling the 50-day for several sessions, the index lost the average on Tuesday. Bulls still hung on to trend-line support from last December. Throughout August, bids consistently showed up at that trend line. The streak was broken on Wednesday (Chart 2).
The 200-day lies at 7379.25. This approximates support at 7300-7400 which drew bids several times in August. In the event things stabilize around this support, bulls’ resolve will be tested at 7700, which approximates the 50-day as well as the underside of the broken Dec ’18 trend line.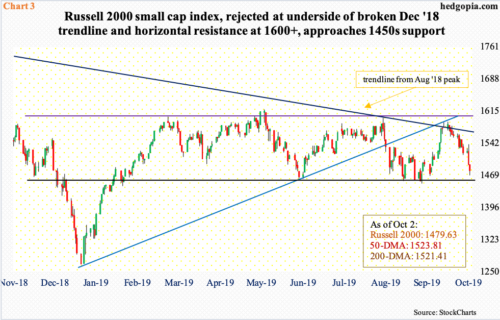
On the Russell 2000 small cap index, that trend line was lost two months ago (Chart 3). Small-caps have lagged their large-cap brethren for a while now. The index (1479.63) peaked at 1742.09 as early as August last year, then bottoming at 1266.92 last December. Bulls nonetheless were persistently denied at resistance just north of 1600, which goes back to January last year. The most recent rejection took place in the middle of August when on the 16th the index tagged 1590.50 intraday; at the time, it also kissed the underside of the aforementioned broken trend line. In the subsequent selloff, both the 50- and 200-day were lost this week. The index is within a stone’s throw away from 1450s, which goes back two years and which bulls repeatedly defended in August. Wednesday’s intraday low was 1469.08.
The daily is now oversold. If the index stabilizes here – or a little lower – the next level to watch is 1520s, where both the 50- and 200-day converge.
Ideally, bulls would want to see the Russell 2000 not breach 1450s and then begin to lead their large-cap peers.
Thanks for reading!
