Next week, the 2Q earnings season begins in earnest. Equities took a big hit in the first half. The sell-side is yet to bring out scissors as relates to 2022/2023 earnings estimates. It will be even more disappointing if corporate managements do not use the 2Q reporting season as a kitchen-sink quarter and cut guidance significantly lower.
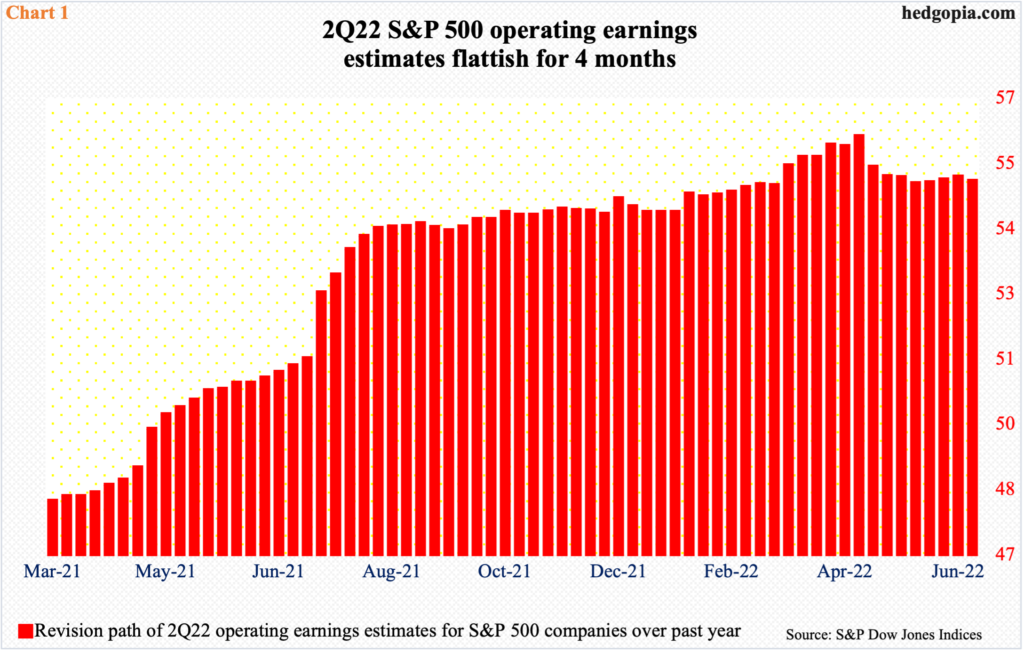
The 2Q earnings season begins in earnest next week. Financials will kick it off with JP Morgan (JPM) reporting on Thursday and Citigroup (C) and Wells Fargo (WFC) on Friday. The sell-side expects S&P 500 companies to earn $55.01 (as of June 29) in operating earnings. This will be up 11.4 percent quarter-over-quarter and up 5.7 percent year-over-year.
Analysts’ estimates for the quarter hit a high of $55.97 as of April 27. As a matter of fact, the consensus has essentially gone sideways the past four months (Chart 1). When the quarter began, the sell-side expected $55.53. The hurdle rate is low – relatively, that is.
Markets in all probability will be focusing more on the outlook and less on how Q2 turns up. Managements will be wise to use this as a kitchen-sink quarter, low-balling 2022 – and 2023 when possible – to the maximum. Stocks have already taken a hit, pricing most – if not all – of it.
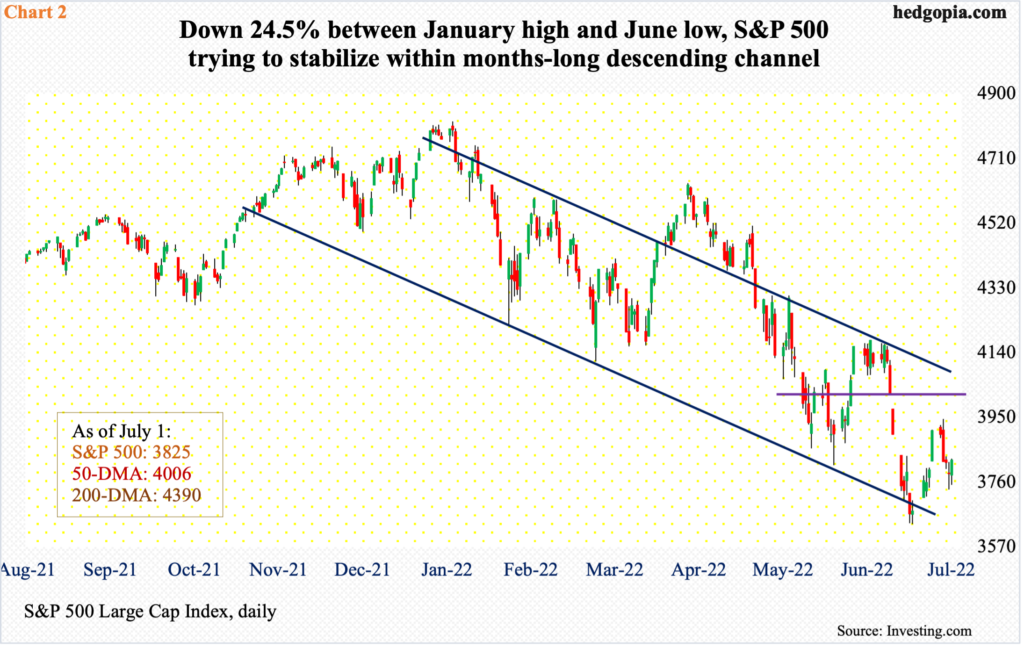
From January’s all-time high of 4819 through last month’s low of 3637, the S&P 500 lost 24.5 percent. Similarly, the Nasdaq 100 index and the Russell 2000 small cap index plunged 34.2 percent and 33.2 percent respectively between last November’s highs and June’s lows.
Last week, the S&P 500 lost 2.2 percent – its 11th down week in the last 13. The large cap index remains above the June 16-17 lows of 3630s and that is good as far as longs are concerned. Shorts, who have gotten aggressive in recent weeks (chart here), can contribute to a rally if forced to cover.
The S&P 500 closed last week at 3825. Ahead, there is gap-down resistance just north of 4000.
Companies, when reporting earnings, can obviously blame it on the rapidly changing macro dynamics and are less likely to be punished for this. The excuse is deteriorating fundamentals.
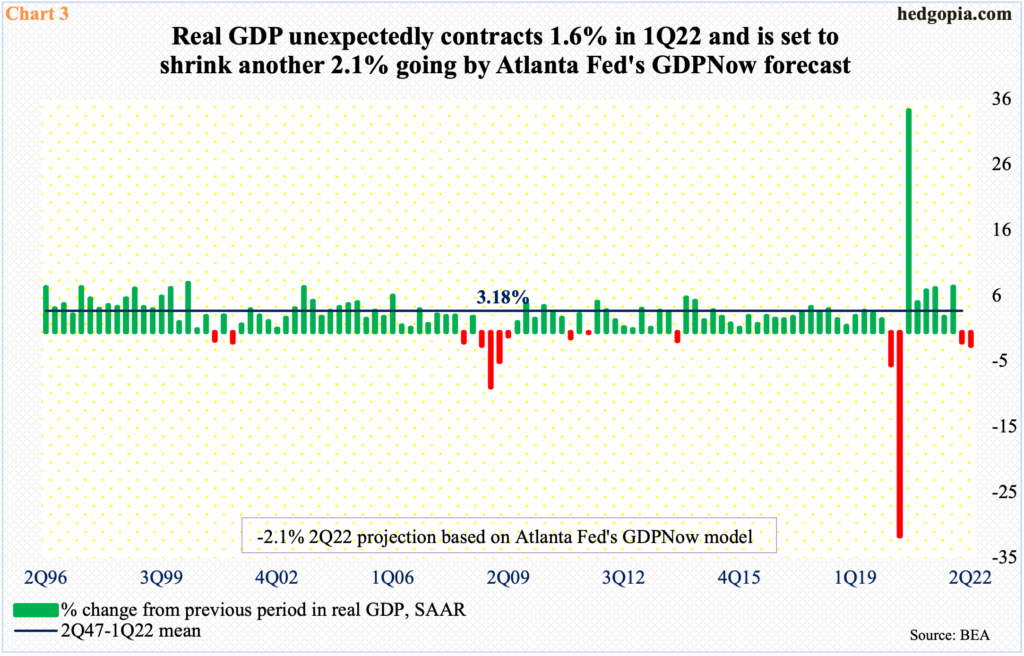
For the first time in seven quarters, real GDP contracted 1.6 percent in 1Q. This was not expected to occur. Similarly, the consensus does not expect the economy to contract again in 2Q. But if the Atlanta Fed’s GDPNow model has it right, that is exactly what is in store; as of July 1, it is forecasting GDP to shrink 2.1 percent on a real basis (Chart 3).
The distinction between nominal and real, that is inflation-adjusted, could not be more important. When inflation was growing in low single digits, it did not matter much. Now it does. In 1Q, nominal GDP posted a new high $24.4 trillion, while real GDP dropped from $19.8 trillion in 4Q21 to $19.7 trillion.
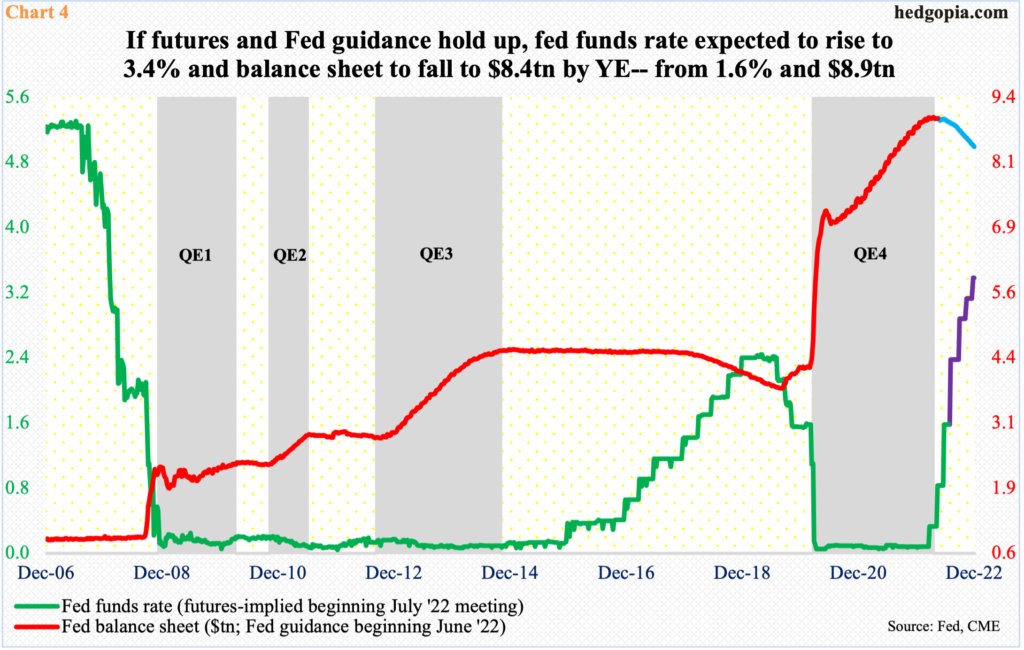
If the economy shrinks back-to-back in 2Q, that is a technical recession. But right here and now, the Federal Reserve is not going to let up. Fearing inflation is getting out of control, it has adopted – although belatedly – a tightening posture and is using both conventional and unconventional tools in this endeavor. On the latter, it has guided its bloated balance sheet to hit $8.4 trillion by the end of the year from the current $8.9 trillion.
Concurrently, the central bank has already raised the benchmark fed funds rate by 150 basis points – by 75 basis points in June, 50 basis points in May and 25 basis points in March. In the Futures market, traders expect another 75 basis points this month, followed by a 50 in September and a 25 each in November and December, ending 2022 between 325 basis points and 350 basis points (Chart 4).
If this indeed comes to pass, it is only a matter of time before this reverberates through the economy/earnings. Just looking at economic activity, the process has already begun and will only intensify as the effects of more rate hikes pass through the system.
The sell-side has not adjusted to this new reality.
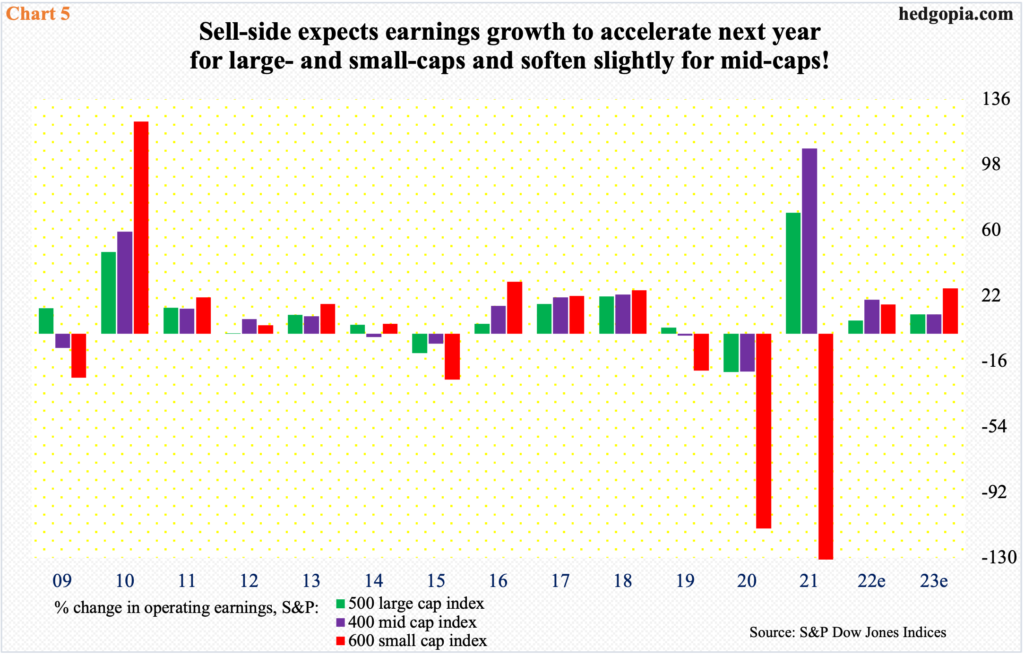
Chart 5 plots the annual growth rate – or a lack thereof – in operating earnings of S&P 500/400/600 companies. This year, as of July 1, they are expected to earn $224.06, $184.17 and $86.80, up 7.6 percent, 19.7 percent and 16.9 percent from 2021, in that order.
Next year, it is only the 400 (mid-caps) where growth is expected to decelerate to 11.3 percent. For 500 (large-caps) and 600 (small-caps), the growth rate is expected to accelerate to 11.1 percent and 26.3 percent respectively (Chart 5). Hard to swallow!
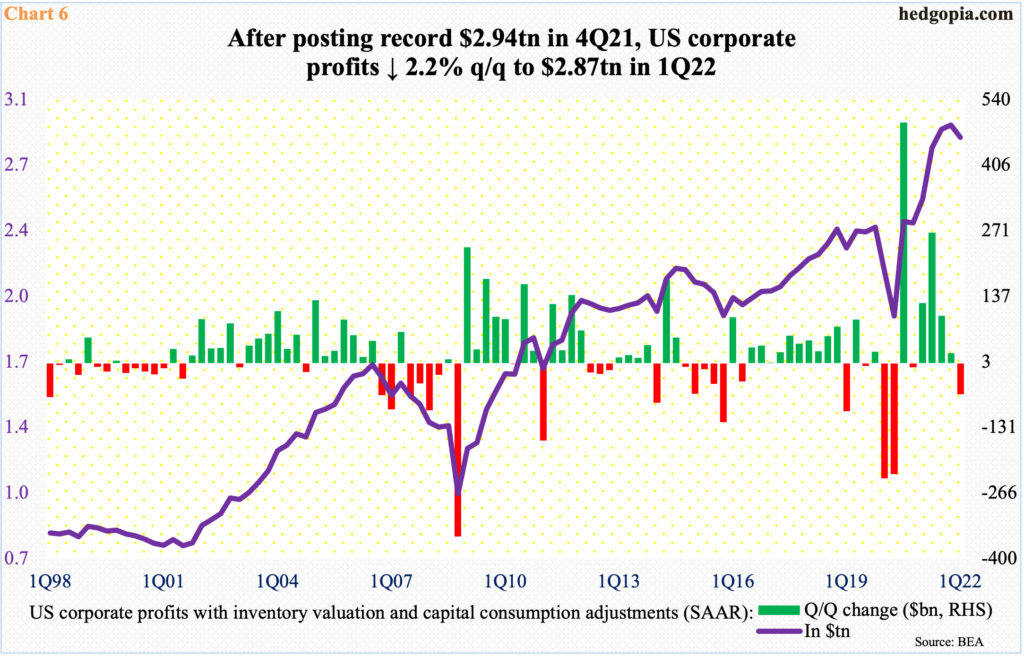
The profit picture likely follows the trajectory seen in 1Q, when S&P 500 companies rang up $417.3 billion in operating earnings, down sequentially from record $456.2 billion ($388.4 billion and $434.3 billion in reported earnings, that is GAAP). This also held true economy-wise.
In 1Q, corporate profits with inventory valuation and capital consumption adjustments declined 2.2 percent to a seasonally adjusted annual rate of $2.87 trillion from $2.94 trillion in 4Q21, which was a record (Chart 6). This despite the fact that nominal GDP rose to a new high during the quarter.
All signs are pointing to imminent downward pressure in earnings. If corporate boards are getting the same vibes – they probably are – they should use the current investor mood to their advantage and cut guidance significantly lower.
Thanks for reading!

