
Markets are aggressively beginning to price in at least two cuts in fed funds this year. It is a little too early, but the Fed is beginning to come around to this dovish scenario. It is easy to get convinced why if one focuses on manufacturing activity and capacity utilization.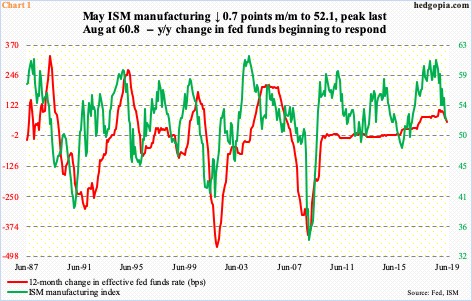
Rate expectations have done quite a U-Turn. Not too long ago, the Fed was preparing markets for a couple more hikes this year. In 2018, they raised three times. Not anymore. The bank has made it clear there would be no hike this year. Rather, in the past few weeks, officials – including Chair Jerome Powell and Vice-Chair Richard Clarida – are dropping hints that they are ready to ease should the economy require one.
The last hike was last December, when the fed funds rate was raised by 25 basis points to a range of 225 to 250 basis points. This was a ninth 25-basis-point increase since the Fed started raising in December 2015. This preceded seven long years of zero-bound policy in the wake of the financial crisis.
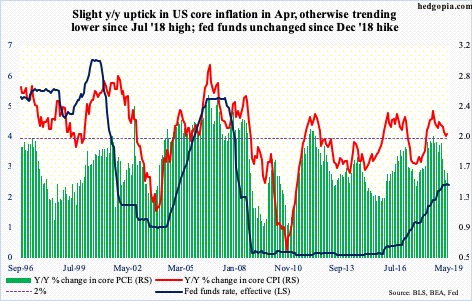
The Fed has a dual mandate of stable prices and maximum employment. With the unemployment rate at 3.58 percent in April – the lowest since December 1969 – and creation of 20.1 million non-farm jobs post-Great Recession, the jobs picture looks decent. (May’s numbers will be published tomorrow.) This is yet to put upward pressure on inflation. The Fed has a two-percent objective. In the 12 months to April, core PCE – the Fed’s favorite measure of consumer inflation – rose 1.57 percent. Going back to May 2012, there has been only one month with a two handle, which was last July (chart here). The so-called Phillips Curve is broken.
This gives the Fed plenty of leeway, in that, depending on the need, they can either focus on jobs or inflation. Odds are they will now increasingly begin to focus on the latter. At least two data points have been suggesting the next major move in rates is lower.
US manufacturing activity continued to soften in May. The ISM manufacturing index edged down 0.7 points month-over-month to 52.1. This was a 31-month low. The index reached a cycle high 60.8 last August.
Historically, it is tough to sustain activity north of 60. Chart 1 plots ISM manufacturing against 12-month change in fed funds. The green line has decidedly turned lower, while the red line has just begun to point lower. Historically, continued softness in manufacturing will be met by lower fed funds.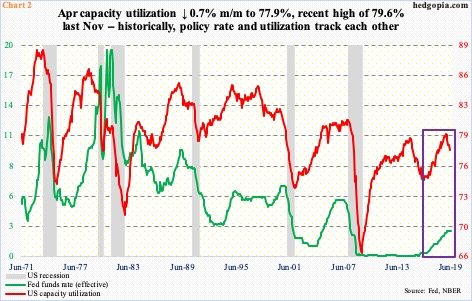
Chart 2 is the same way.
Post-financial crisis, capacity utilization never crossed 80 percent. Last November’s 79.6 percent was the cycle high. Since then through April, utilization has dropped by 1.6 percentage points to 77.9 percent. (May’s utilization is slated for Friday next week.)
Once again, the red line in the chart has decidedly taken a turn lower. The green line, having flattened out since December, is yet to respond. Back in November, utilization similarly peaked at 79.2 percent, subsequently bottoming at 74.6 percent in May 2016. In response, the Fed could only leave fed funds at zero-bound, as its monetary quiver was short of arrows. Thanks to the afore-mentioned nine hikes since December 2015, it now has a few arrows at its disposal.
A cut looks imminent. Markets are smelling one as well, with fed funds futures pricing in a cut in July and then another in September, and maybe one in December as well.
Thanks for reading!
