
After coming under pressure for months, the ratio of inventories to sales has slightly risen since bottoming last November. It is worth watching.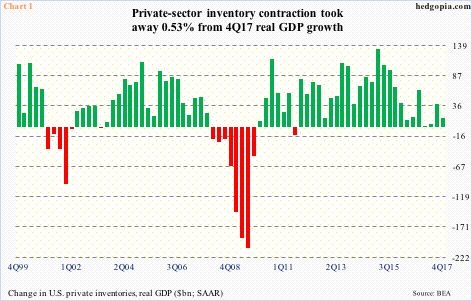
US real GDP growth decelerated to 2.9 percent in 4Q17. This followed growth of 3.2 percent in 3Q17 and 3.1 percent before that.
Growth in the last three quarters of 2017 came in much stronger than the post-Great Recession average of 2.2 percent. In fact, it is comparable to the long-term (going back to 2Q47) average of 3.2 percent.
In 4Q17, among other things, the deceleration in growth reflected a reduction in private-sector inventory investment (Chart 1). Inventory contraction took away 0.5 percent from real GDP growth.
It is possible inventory build contributes to GDP growth in 1Q18. The advance numbers will be reported Friday next week. As of Tuesday, the Atlanta Fed’s GDPNow model was forecasting growth of two percent.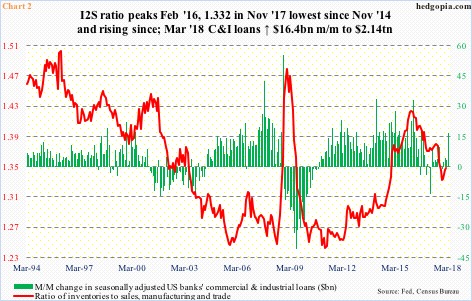
In US manufacturing and trade, the inventories-to-sales ratio peaked in February 2016 at 1.424. It then bottomed at 1.332 last November. Peak to trough, inventories rose 5.3 percent and sales 12.6 percent. Hence the decline in the ratio (Chart 2).
Since the ratio bottomed last November, inventories have risen 1.8 percent and sales 0.5 percent. In February, they respectively stood at $1.93 trillion and $1.43 trillion (seasonally adjusted annual rate). The ratio has been rising, and it is possible it rose further in March.
Banks’ commercial & industrial loans jumped $16 billion month-over-month in March to $2.14 trillion – a new high.
The inventory situation needs monitoring. Particularly when growth likely decelerates from here.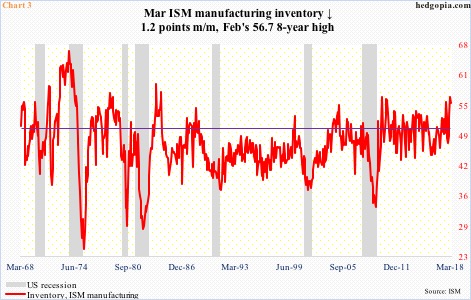
The ISM manufacturing index dropped 1.5 points m/m in March. But February’s 60.8 was the highest since May 2004. The index has remained north of 50 since September 2016. It is difficult to sustain this kind of activity, which in all likelihood softens in months/quarters ahead. This will reverberate through the economy. The ISM index correlates well with GDP, equity indices, and what not.
Along the same lines, ISM manufacturing inventories in March fell 1.2 points m/m to 55.5, with February at an eight-year high (Chart 3). Inventories are elevated.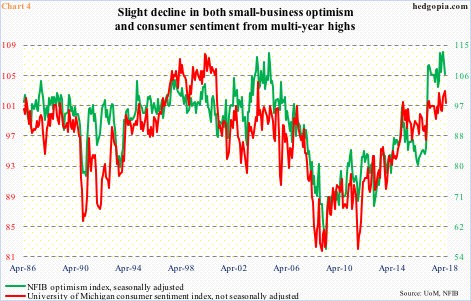
This is coming at a time when sentiment remains elevated.
Chart 4 pits University of Michigan’s consumer sentiment index against the NFIB optimism index. Both surveys highlight the prevailing optimism among small businesses and consumers.
In March, small-business optimism fell 2.9 points m/m, but February’s 107.6 was the second highest level in its history. Monthly data goes back to 1986.
Similarly, April’s preliminary reading showed consumer sentiment dropped 3.6 points from March’s 101.4, which was the highest since January 2004.
The point is, the recent increased activity reflected in manufacturing and GDP data probably reflects this elevated optimism among consumers and small businesses. It is not easy to sustain these levels. Arguably, the path of least resistance is down.
This supports the earlier argument that manufacturing likely takes a breather in months/quarters to come. Thus the need to watch inventories.
Thanks for reading!
