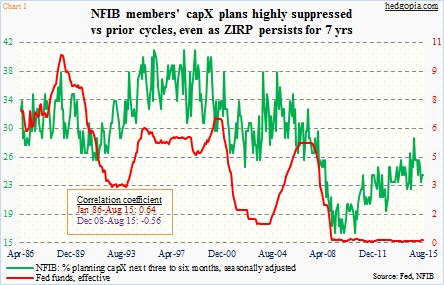
It has been a consistent theme post-Great Recession. U.S. businesses have persistently disappointed when it comes to capital expenditures. It does not look like we will see a trend change anytime soon.
The National Federation of Independent Business, representing small businesses, published its August survey yesterday. The main index inched higher month-over-month from 95.4 to 95.9; members’ capex plans were unchanged at 24, down five points from post-recovery high of 29 last December (Chart 1). The main index peaked in that month as well.
It is hard to fathom corporate hesitancy given interest rates are historically low. But then again, it is hard to establish a cause-effect relationship between the two. Rates have stayed low for nearly seven years, and one can argue that this takes away the incentive to move now in fear of higher rates tomorrow… almost like it pays to wait for consumption in times of deflation, as prices tomorrow will be lower than today’s.
So begs a question, if the Fed does indeed begin a tightening process in a week’s time, would that coax businesses into action? Remains to be seen. If I were to venture a guess, probably not. The end-demand is weak. The debt load is too high. And there are simply too many uncertainties, both at home and abroad, for businesses to want to get too aggressive.
In this scenario, the height of the green bars on the right side of Chart 2 should continue to remain small. In the second quarter, non-residential fixed investment contributed 0.41 percent to real GDP growth. In the first estimate, this was reported as having subtracted 0.07 percent from growth. An upward revision has once again rekindled hopes of a capex revival.
Recent trends have also been positive in non-defense capital goods ex-aircraft – proxy for business capex. Most recently, orders for both June and July were slightly revised upward, with month-over-month increases in both. Although orders peaked at a seasonally adjusted annual rate of $74 billion last September, with July $4 billion lower. Year-over-year, growth has been negative the past six months (Chart 3).
Needless to say, the sooner the inventory picture improves, the better. The good thing is, the green line in Chart 3 has shrunk the past couple of months; inventory has been revised lower in May-July, and that has helped. But it remains elevated – at $121.1 billion in July, down from $121.9 billion in April.
Chart 4 portrays a similar picture – only on a bigger scale. U.S. banks’ consumer & industrial loans made an all-time high of $1.9 trillion (seasonally adjusted) in July, and have grown month-over-month since October 2010, with sporadic spikes. This has been accompanied by a gradual rise in the ratio of inventories to sales in manufacturing & trade, with a sharp rise beginning last July. (In June, inventories were $1.81 trillion, and sales $1.33 trillion.) Come July, there is a chance inventories further push up.
Why?
In the second estimate of 2Q15 U.S. real GDP, growth was revised higher from the original 2.3 percent to 3.7 percent. Among others, both non-residential fixed investment and private inventory increased. Originally, both were estimated to have slightly decreased. As a matter of fact, in the second estimate inventory contributed 0.22 percent to growth. The steady increase in inventory – particularly the past couple of quarters – is seen in Chart 5. And this is a potential problem. Burning off excess inventory comes with cost – suppression of growth in the out quarters. The Atlanta Fed’s GDPNow model is currently forecasting 1.5 percent growth in the third quarter.
The upshot? In all probability, the prevailing subdued capex environment lingers on.
Thanks for reading!

