
Near-term, equity bulls may just have wasted an opportunity to put their foot down. Mid- to long-term, both margin debt and share buybacks are no longer a potent tailwind as they once were.
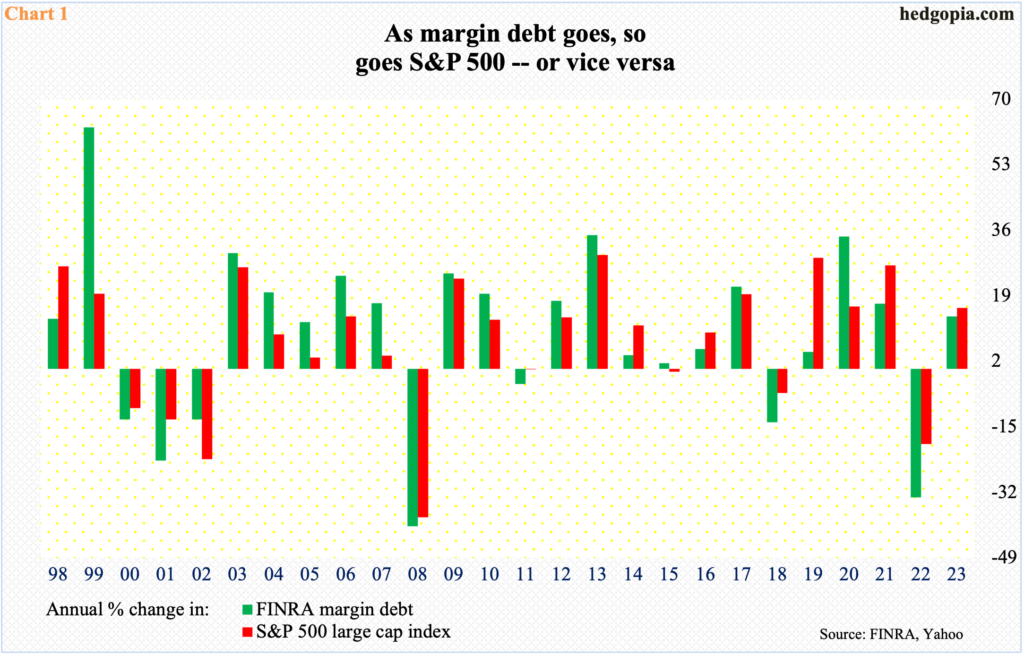
FINRA margin debt dropped 2.9 percent month-over-month ($20.6 billion) in August to $689 billion. July’s $710 billion was a 14-month high.
In the first eight months this year, margin debt is up 13.6 percent. It correlates nicely with the S&P 500 large cap index, which through last Friday is up 15.9 percent (Chart 1).
Last December’s $607 billion represented a low since reaching an all-time high of $936 billion in October 2021. The Nasdaq 100 index and the Russell 2000 small cap index peaked in November 2021, while the S&P 500 did so two months later in January 2022.
Last December’s trough in margin debt preceded a bottom in all the major equity indices in October. The correlation between the two variables is still there, but it increasingly feels like investor appetite for leverage has waned.
At the July 27 high of 4607, the S&P 500 was 4.6 percent from its record high of 4819 reached in January last year. Meanwhile, July’s margin debt needed to increase another 31.8 percent to match the October 2021 record.
Margin debt is no longer a potent equity tailwind as it once was. This also holds true with buybacks.
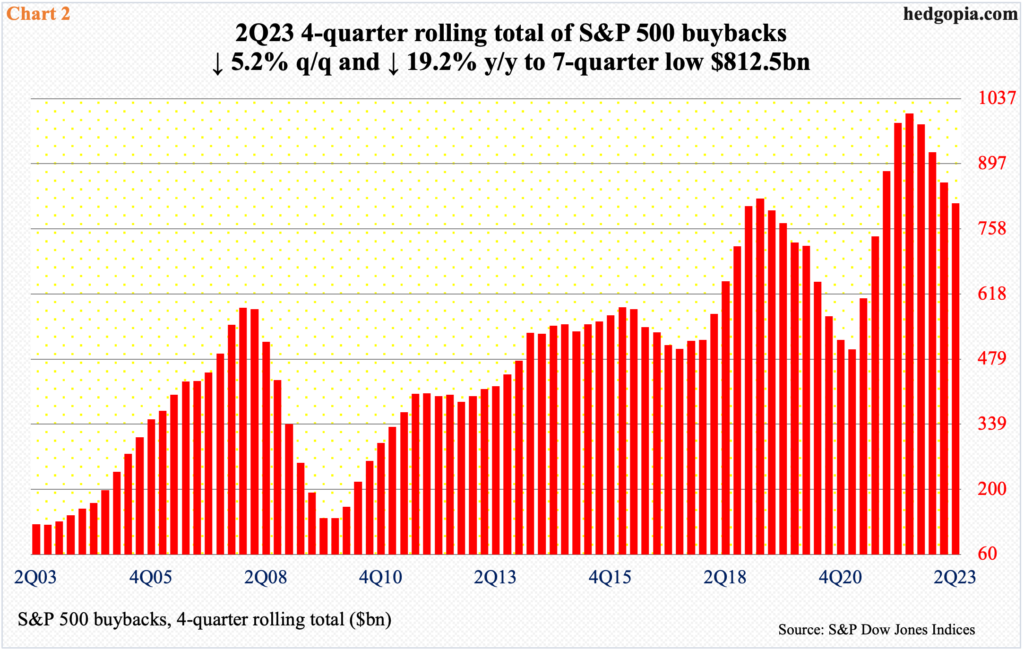
In the June quarter, S&P 500 companies spent $175 billion to buy back their own shares. This was a 10-quarter low. In 3Q21, they spent a record $235 billion, which was surpassed by the very next quarter’s $270 billion and again by 1Q22’s $281 billion. From that high, buybacks gradually declined.
Once again, the above-mentioned equity indices peaked between November 2021 and January 2022. This was a time S&P 500 buybacks were reaching a crescendo. Once they peaked, so did equities.
The momentum now is down – evident in the four-quarter rolling total (Chart 2). On this basis, since reaching $1,005 in 2Q22, buybacks have dropped every quarter, to last quarter’s $813 billion, which was down 5.2 percent quarter-over-quarter and 19.2 percent year-over-year.
Mid- to long-term, the risk now is that margin debt and share buybacks are turning into a headwind. Near-term, equity bulls just wasted an opportunity to deny bears an opening.
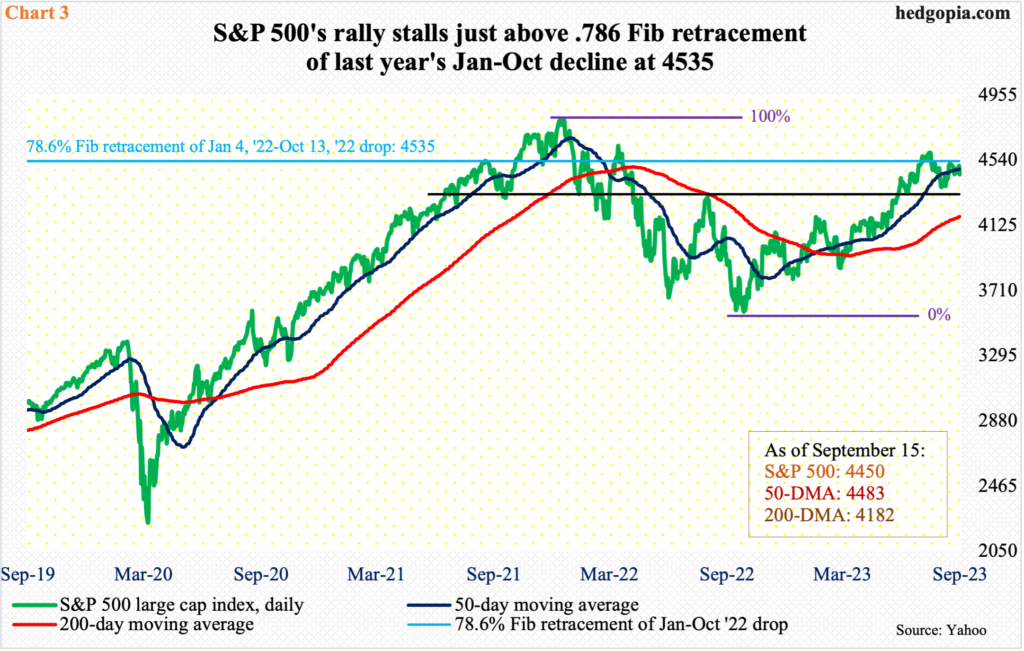
Last Thursday, at the session high, the S&P 500 was up 1.2 percent for the week. Come Friday, bulls gave it all back, and then some. With Friday forming a bearish marubozu open candle, the week ended down 0.2 percent to 4450. Bulls and bears have fought for control of 4450s for several weeks now. A probable breach opens the door toward breakout retest at 4320s (Chart 3).
Importantly, the index last Friday was pushed back under the 50-day moving average at 4483. Of note, the S&P 500 began to run out of steam shortly after retracing 78.6 percent of the drop between last year’s January and October.
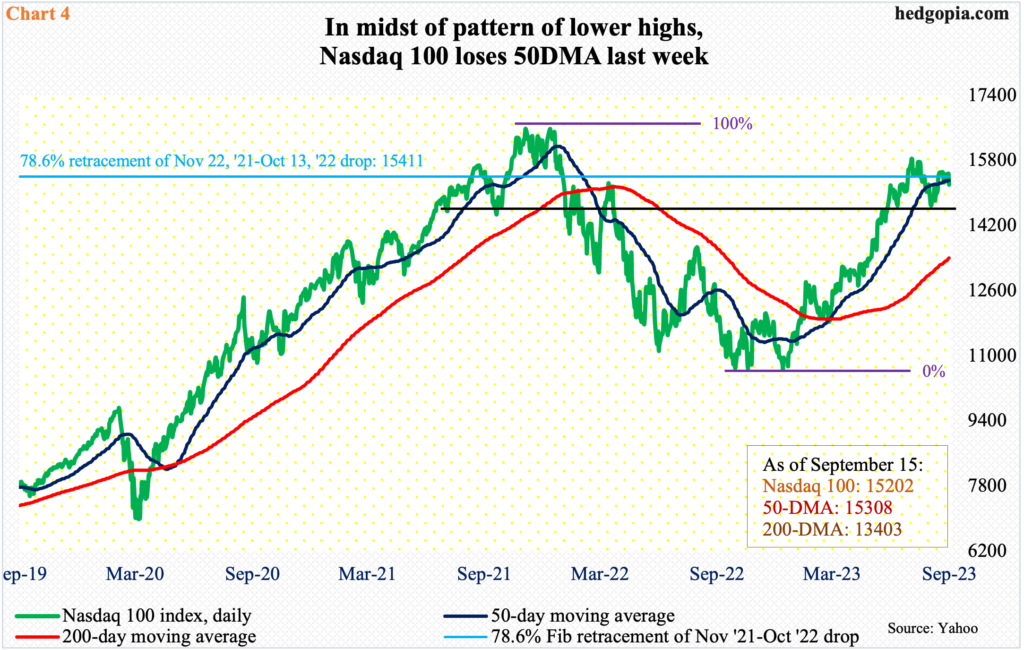
The Nasdaq 100, too, has lost its 50-day. Similar to the S&P 500, the tech-heavy index retraced slightly more than 78.6 percent of the drop between the November 2021 peak (16765) and the October 2022 trough (10441) before reversing. It ended last week at 15202, down 0.5 percent.
The inability early this month to take out the July 19th high of 15932 has established a pattern of lower highs. The November 2021 peak was followed by a lower high 16607 in December and then the one in July.
Last week, after remaining at/above the average in the first four sessions, the 50-day (15308) was lost on Friday, also forming a bearish marubozu open candle. As things stand, tech bears are probably eyeing last month’s low (14558).
Small-caps are acting worse.
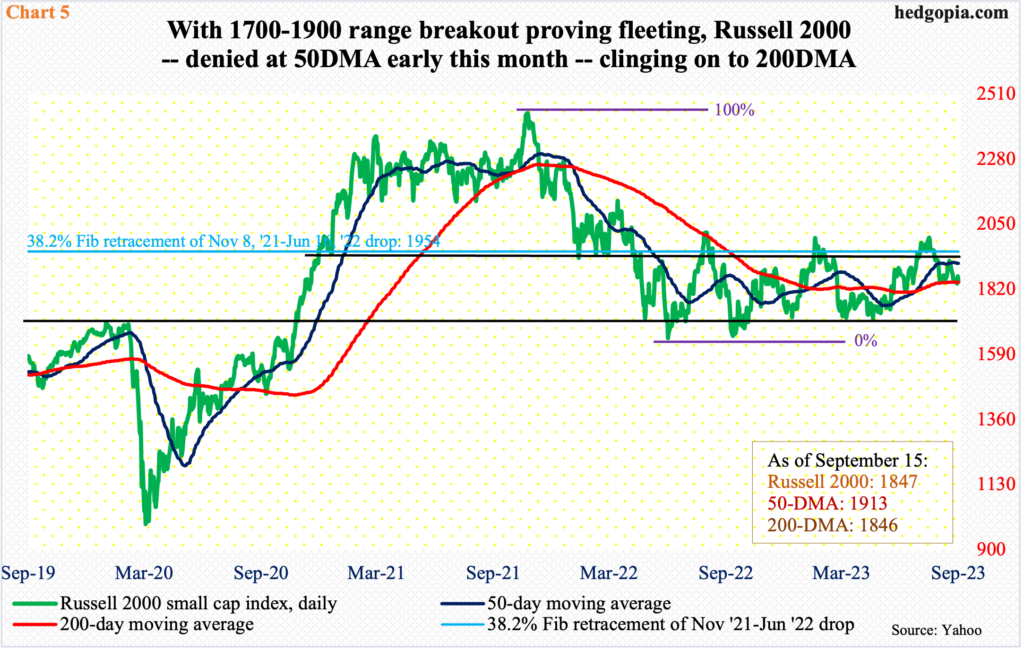
The Russell 2000 was only able to retrace slightly more than 38.2 percent of its drop between November 2021 and June/October 2022, falling short of retracing half of the decline.
Shortly after the November 2021 peak, the Russell 2000 has been rangebound between 1700 and 1900 since January last year. A breakout occurred on July 11 (this year). After that, the small cap index went on to rally to 2004, which was hit on July 31, but came up short of eclipsing the February (2023) high of 2007. The downward pressure since found support at 1830s twice last month – on the 18th and 25th. Last Wednesday, 1830s again found buyers, as the index tagged 1838 intraday, finishing the week at 1847.
Early this month, the Russell 2000 failed at the 50-day (1913) and is now back at testing the 200-day at 1846 (Chart 5). Once the latter yields, it becomes easier for small-cap bears to go attack at least the midpoint of the range – 1800.
Macro-wise, it is never a good sign that small-caps are lagging their equity peers by this much. Small-caps inherently have larger exposure to the domestic economy than their large-cap brethren – the reason why they are treated as one of the ways to take a measure of the economy. In this respect, the news is hardly encouraging. Large-caps, which have been used by investors as a hideout, cannot remain immune from this for too long.
Thanks for reading!
